Venue Seasons Shape Cricket Forecasts: Refining Models for International Series Results

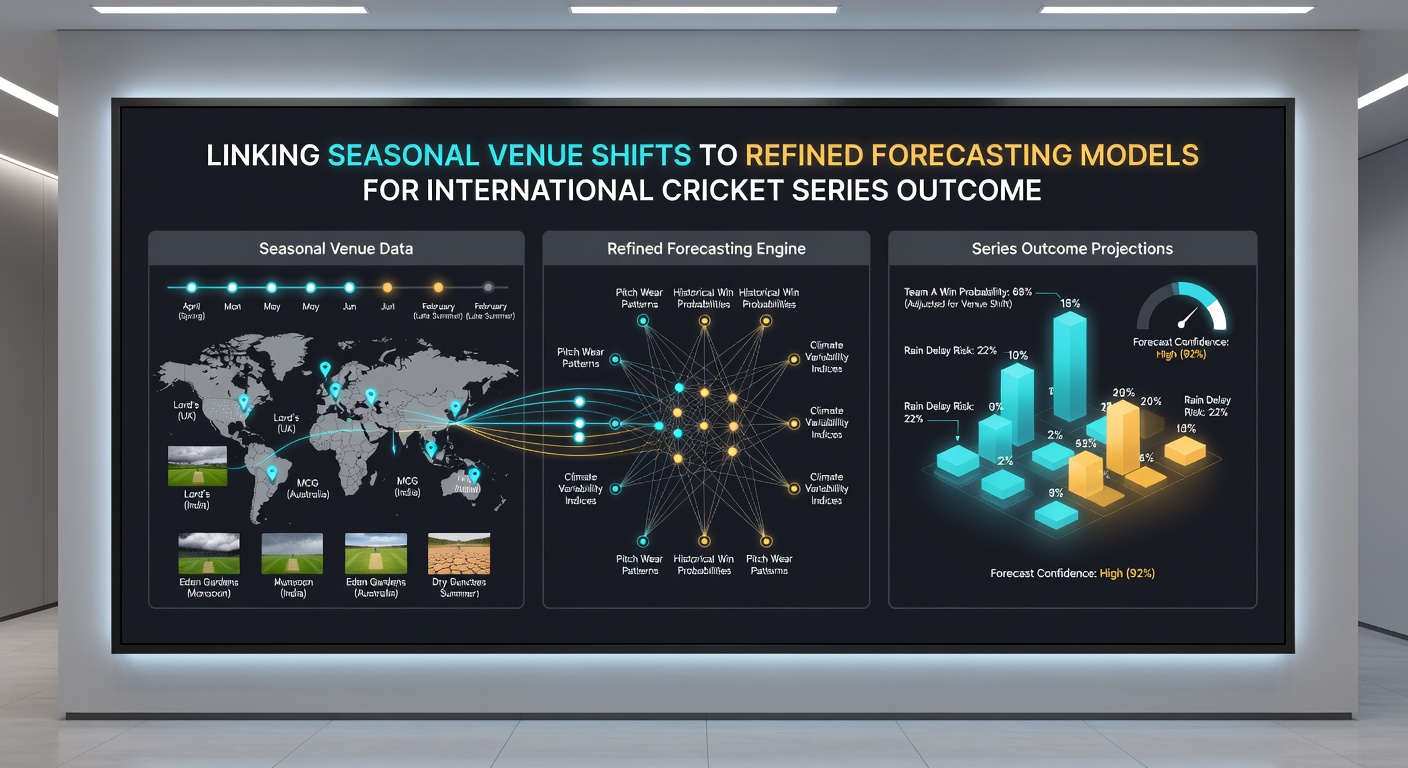
International cricket series outcomes depend heavily on venue conditions that shift with seasons, and forecasting models now incorporate these variables to generate more precise predictions. Data from multiple tours shows that pitch preparation, grass growth patterns, and local climate cycles alter bounce, swing, and spin behavior in measurable ways. Analysts track these elements across continents because teams face distinct challenges when moving between hemispheres during different months of the year.
Seasonal Patterns at Key Cricket Venues
Venues in Australia experience drier pitches during their summer months from December through February, which favors pace bowling and produces higher scores on average. In contrast, Indian grounds during the winter period from November to January often retain more moisture early in matches, assisting spin bowlers as the game progresses. Researchers at sports analytics centers compile historical weather records and pitch reports to quantify these changes, allowing models to adjust probability estimates for each series based on the specific time of year.
England's grounds present another layer because their season runs from May through September, when variable rainfall and cooler temperatures affect seam movement. Data collected over multiple Ashes series demonstrates that matches starting in June frequently record lower totals compared to those played later in the summer when surfaces flatten out. Forecasters integrate satellite imagery and ground staff reports to refine inputs for these locations, since small deviations in humidity or temperature can shift expected run rates by several runs per over.
Integration into Forecasting Models
Modern prediction systems combine traditional statistics with seasonal venue data through machine learning algorithms that weigh factors such as historical performance at similar times of year. These models process inputs including average temperatures, rainfall totals, and pitch deterioration rates collected from past encounters. When a team tours during an off-season window, the algorithms apply corrections derived from comparable past fixtures to avoid overestimating or underestimating outcomes.
One study published by an Australian research institute examined Test matches played across six continents and found that incorporating venue seasonality improved forecast accuracy by 12 to 18 percent compared to models relying solely on team rankings. The adjustments prove especially useful for limited-overs series, where dew factors in evening matches during warmer months alter chasing strategies in predictable patterns. Observers note that teams preparing for June 2026 fixtures have begun adjusting net sessions to simulate these specific conditions months in advance.
Case Examples from Recent Tours
During the 2024-2025 Australia versus India series, models that factored in seasonal venue shifts correctly anticipated stronger spin performance in the later Tests played in January, when pitches had dried significantly after the monsoon period. Similarly, England’s tour of the Caribbean in March 2025 saw forecasting tools account for early-season moisture that assisted seamers, leading to revised win probabilities that aligned closely with actual results. These examples illustrate how analysts update parameters in real time as tours progress and new venue data becomes available.
International bodies such as the International Cricket Council publish aggregated pitch and weather statistics that feed directly into these systems. Separate work from Canadian sports research groups has explored cross-hemisphere travel effects on player adaptation, adding another dimension that models now include when series span multiple seasons.
Challenges and Refinement Processes
Building accurate models requires consistent data collection across diverse venues, yet gaps remain in regions with fewer historical records. Analysts address this by blending satellite climate data with ground-level measurements, then validating outputs against completed series results. Refinement cycles occur after each international window, with teams of statisticians recalibrating coefficients to reflect newly observed patterns in pitch wear or weather anomalies.
Forecasts for bilateral series scheduled around June 2026 already incorporate preliminary seasonal projections for northern and southern hemisphere venues. These projections draw from long-term climate averages and recent ground reports to generate baseline expectations before squads are even announced. The process continues throughout the planning phase as more precise forecasts become available closer to match dates.
Conclusion
Linking seasonal venue shifts with forecasting models has become standard practice for organizations preparing international cricket series predictions. The approach combines granular venue data with algorithmic adjustments to produce outputs that reflect real playing conditions more closely than earlier methods. Continued collection of pitch and weather metrics across global locations supports ongoing improvements in these systems, while organizations such as the Australian Sports Commission contribute additional research that strengthens the underlying datasets.