Shot Selection Science: How Basketball Analytics Guide Optimal Shot Locations During High-Pressure Game Phases
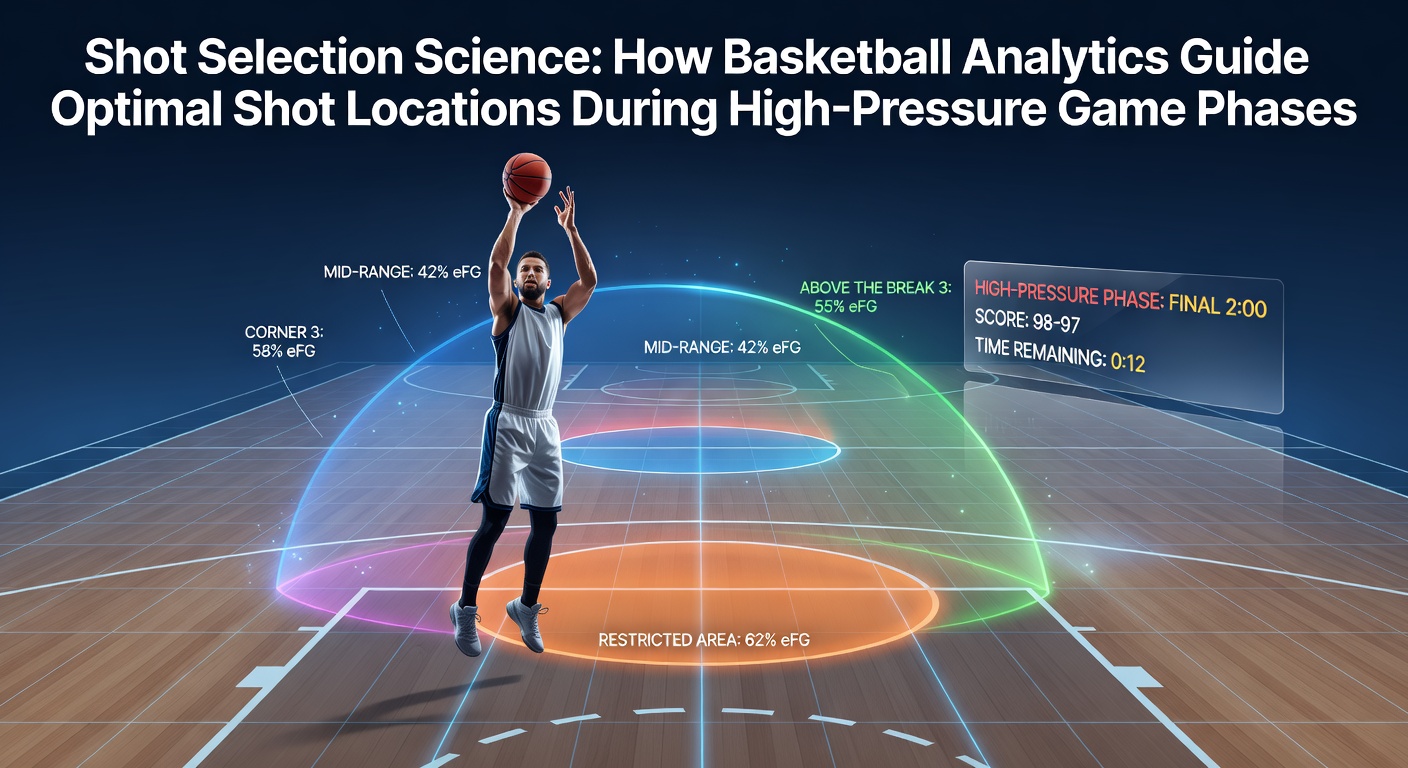
Teams across professional basketball leagues have increasingly turned to detailed tracking systems that capture every movement and outcome on the court, and these datasets now shape decisions about where players should attempt shots when games reach their most intense stretches. In high-pressure phases, defined typically as the final five minutes with the score within six points, coaches and analysts examine historical efficiency rates for different court locations rather than relying on intuition alone.
Defining High-Pressure Situations Through Data
Researchers have identified consistent patterns in how shot success rates shift under tight conditions, and league-wide figures reveal that overall field goal percentages drop by several points compared to earlier quarters. Data from multiple seasons shows corner three-point attempts maintain relatively stable conversion rates even late in contests, whereas mid-range jumpers see steeper declines in accuracy. Analysts compile these trends from optical tracking cameras installed in arenas, and the resulting models help teams prioritize locations that deliver the highest expected points per possession when time runs short.
Core Metrics Driving Location Choices
Expected points added calculations sit at the center of modern shot selection frameworks, and these figures combine shot frequency, success probability, and defensive pressure readings gathered during similar past moments. Teams adjust lineups and play calls based on individual player profiles that highlight strengths in specific zones during clutch windows. For instance, some guards post higher efficiency on pull-up threes when defenders close out aggressively, while others thrive on floaters inside the paint because those attempts reduce the impact of rim protection. Studies from academic institutions continue to refine these models by incorporating factors such as fatigue indicators and opponent defensive schemes tracked over entire seasons.
Geographic Variations in Optimal Zones
Shot location preferences differ notably across conferences and international competitions, and European leagues often emphasize interior play more than North American circuits because rule variations affect spacing and defensive help rotations. Data collected through 2026 demonstrates that teams employing wider spacing schemes generate more open three-point looks in the final minutes, while squads relying on isolation sets see higher volumes of contested mid-range attempts. Analysts compare these outcomes against benchmarks from prior playoff runs to determine whether adjustments in spacing can improve results under similar pressure.
Technology Behind the Recommendations
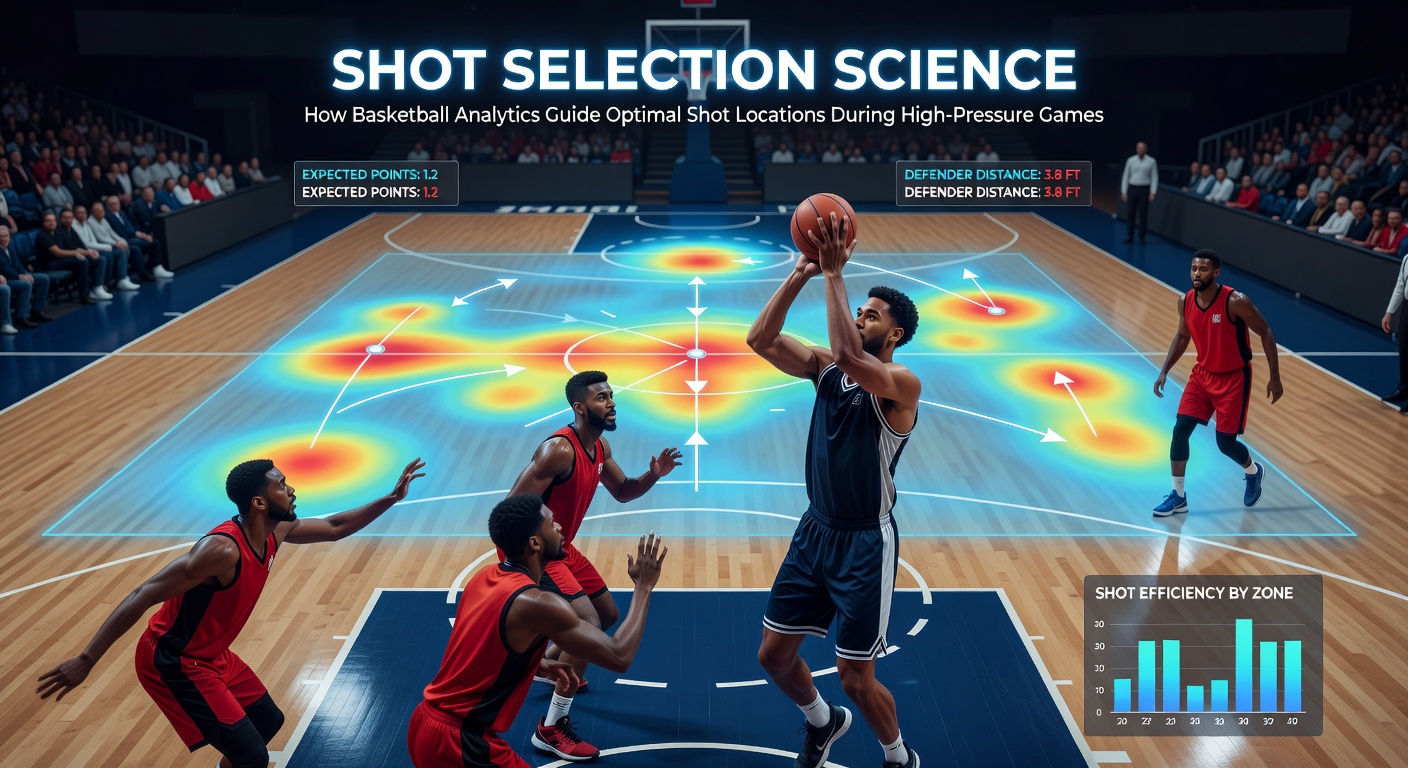
Player tracking platforms capture positional data at high frequency rates, and this information feeds into machine learning algorithms that simulate thousands of potential shot attempts for given game states. The outputs produce heat maps that update in real time during broadcasts and coaching meetings alike. In May 2026, several franchises began integrating additional wearable sensor data to account for heart rate and movement economy, which helps refine predictions about which players can sustain efficiency on perimeter attempts late in overtime periods. These combined datasets allow staff to simulate scenarios where a player receives the ball at the top of the key versus drifting toward the wing, and the models quantify the expected value difference.
One research initiative led by Canadian sports scientists examined how defensive schemes alter shot selection in international tournaments, and their findings indicated that teams facing zone defenses shifted toward higher-percentage corner attempts more frequently than those matched against man-to-man coverage. Such insights have prompted coaching staffs to pre-load location-specific drills during practice sessions focused on late-game execution.
Practical Applications in Recent Playoffs
During postseason series, franchises review thousands of possessions from regular season clutch situations to build tailored playbooks, and these preparations often include scripted actions designed to create looks at locations where individual players have posted above-average results. League statistics released ahead of the 2026 postseason showed that squads with dedicated analytics departments attempted a higher share of corner threes in the final minutes compared to teams without such support structures. The difference appears in both volume and efficiency metrics, suggesting the data influences both preparation and in-game adjustments.
Challenges in Model Implementation
While tracking systems provide granular detail, variables such as crowd noise, referee tendencies, and unexpected injuries introduce uncertainty that statistical models cannot fully capture. Analysts therefore combine quantitative outputs with qualitative observations from video review, and this hybrid approach has become standard across most organizations. Reports from governing bodies in multiple regions continue to emphasize the need for transparent methodologies when using analytics to influence player roles during critical moments.
Future Directions for Shot Analytics
Emerging work focuses on real-time integration of opponent scouting reports into shot probability engines, and early tests indicate potential gains in accuracy when defensive personnel groupings are factored into location recommendations. Academic papers presented at sports analytics conferences have explored multi-agent reinforcement learning techniques that simulate how both offense and defense adapt their positioning dynamically in the closing seconds. These advancements build on existing frameworks rather than replacing them, and practitioners expect incremental improvements in predictive power over the coming seasons.
Conclusion
Basketball organizations now treat shot location decisions in high-pressure phases as a data-driven discipline supported by extensive tracking infrastructure and refined statistical models. The patterns uncovered through these systems guide everything from daily practice design to in-game substitutions, and ongoing research ensures the frameworks evolve alongside changes in playing styles and rule interpretations. Teams that integrate these tools effectively position themselves to maximize efficiency when margins are smallest, while continued collaboration between analysts and coaching staffs helps translate complex outputs into actionable strategies on the floor.