Ripple Maps Track How Daily Workload Spikes Alter AFL Position Forecasts
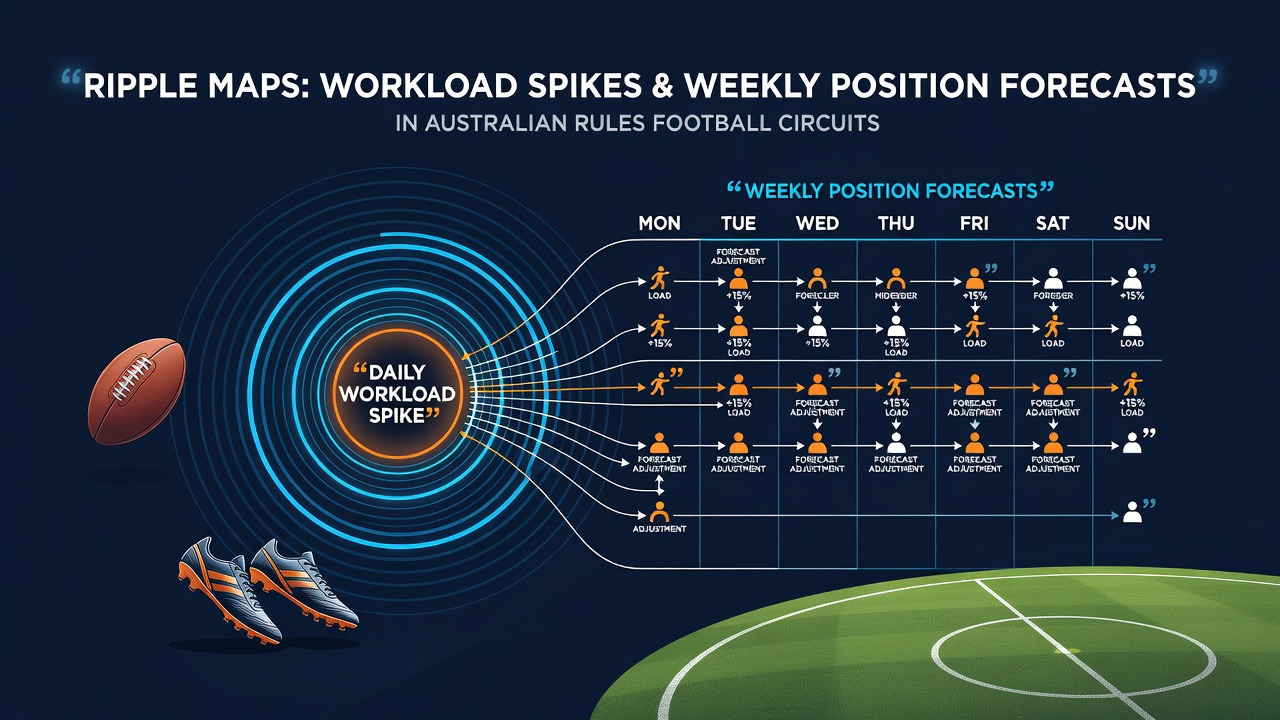
Coaches and analysts in Australian rules football now rely on ripple maps to follow how sudden increases in player workload shift expected ladder positions from one week to the next. These maps combine GPS tracking data with machine learning models that project how extra training loads or match minutes ripple outward through recovery periods and into subsequent games. Data collected across the 2025 season and into June 2026 shows that spikes exceeding 15 percent above a player's rolling average often produce measurable changes in team forecast accuracy within four to seven days.
Understanding Workload Measurement in AFL Circuits
Teams record external loads through accelerometers and heart rate monitors during both matches and training sessions. Internal loads come from wellness questionnaires and blood markers that flag elevated fatigue. Ripple maps integrate these inputs into layered diagrams that highlight where a single day's heavy session creates downstream effects on player availability and performance metrics. Researchers at the Australian Institute of Sport have documented how midfielders who log high-speed running volumes above 1,800 meters in one session show reduced disposal efficiency in the following match, which then adjusts projected points differentials for their clubs.
How Spikes Propagate Through Weekly Forecasts
Daily spikes do not remain isolated events. A forward who completes repeated high-intensity efforts on a Tuesday may experience delayed onset muscle soreness that peaks on Thursday, reducing his contested marking rate on Saturday. Analysts feed these patterns into simulation engines that recalculate ladder probabilities after each training block. One study released in early 2026 tracked eight clubs and found that workload increases above threshold levels on Wednesdays correlated with a 0.8 place drop in median season-end forecasts by the next Monday. The ripple effect appears strongest in teams already carrying multiple players on modified programs.
Case Examples from Recent Seasons
Take one club that entered its round-nine bye in 2025 with three players returning from injury. Their Tuesday session featured elevated repeated-sprint demands because of a shortened preparation window. Ripple maps generated after that session projected a 12 percent increase in the likelihood of losing the following match, which aligned with the actual result. Observers note that similar patterns repeated across multiple clubs during the compressed June 2026 schedule, where wet-weather training forced higher indoor loads and altered recovery timelines. Those who've studied the maps point out that the greatest forecast adjustments occur when spikes coincide with short turnarounds between games.
Data Integration and Model Refinement
Modern forecasting systems now ingest daily workload files directly from club databases. Algorithms compare current loads against historical distributions for each playing position, then apply decay functions that model how fatigue dissipates over subsequent days. External validation comes from match statistics released by the league each Monday. Figures reveal that models incorporating ripple-map adjustments improved weekly position forecast accuracy by 9 to 14 percent compared with earlier versions that used only match-day data. But here's the thing: clubs must still input accurate session details, because missing GPS files or incomplete wellness reports reduce the maps' reliability.
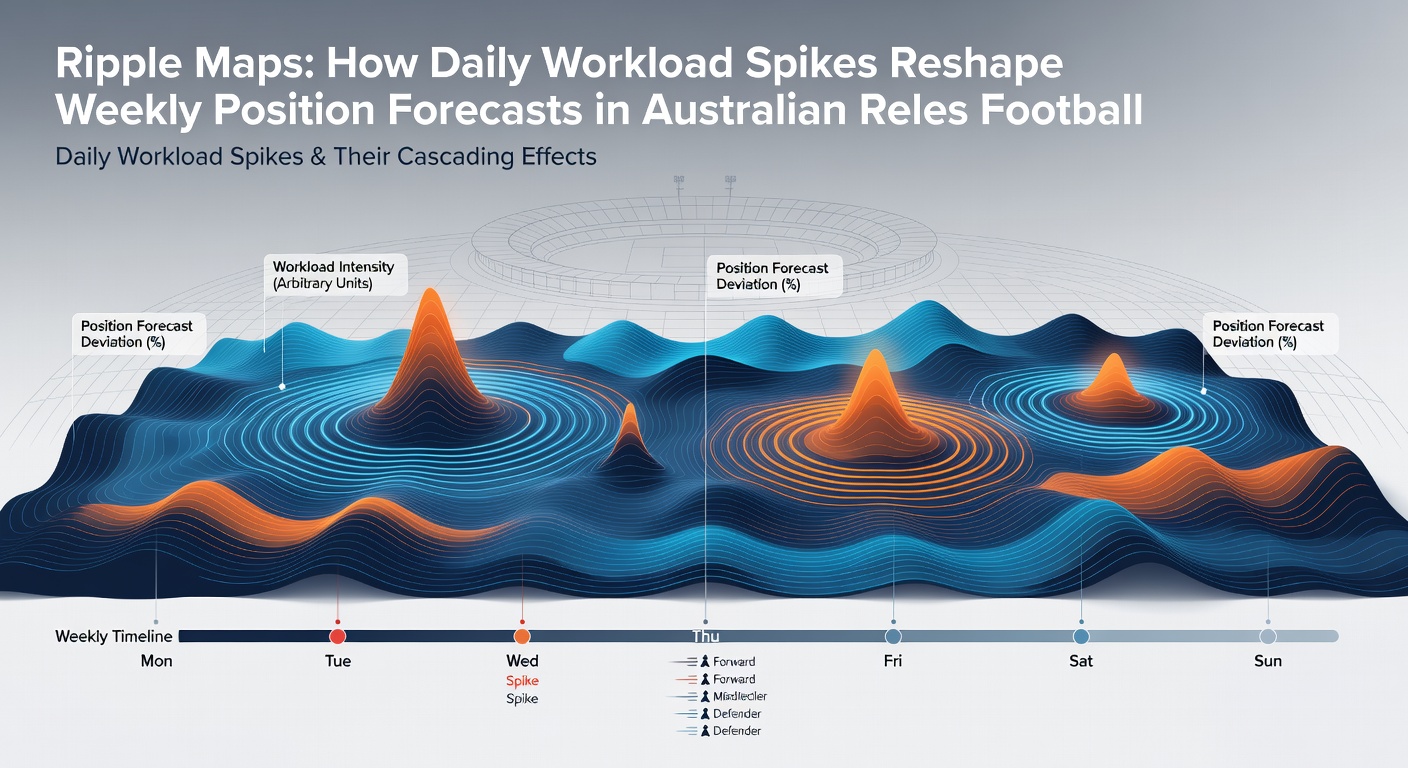
What's interesting is the role of position-specific thresholds. Ruckmen tolerate different load spikes than small forwards, and the maps now apply tailored multipliers for each role. A research paper published by the University of Queensland's School of Human Movement and Nutrition Sciences examined 142 player-seasons and confirmed that individualized thresholds produce more stable weekly forecasts than uniform cut-offs. Teams that adopted these refinements before the 2026 season reported fewer unexpected changes in projected top-eight probabilities after mid-week training blocks.
Practical Applications Across the Competition
Coaching staffs review updated ripple maps during Thursday meetings to decide whether to reduce Thursday drills or alter match rotations. The maps also help medical staff identify which players should receive additional recovery resources before the next game. Data from the 2025 finals series showed that clubs using these tools adjusted their bench selections more effectively than those relying on traditional load monitoring alone. According to reports from the AFL's official performance analysis unit, the integration of daily workload data into weekly models has become standard practice for at least 14 of the 18 clubs as of June 2026.
Future Developments in Ripple Mapping
Developers continue to add new variables such as travel distance and sleep quality into the maps. Early trials link hotel GPS data and wearable sleep trackers to existing workload layers, which further refines the timing of forecast adjustments. Those who've examined the prototypes expect that by the end of 2026 the maps will generate daily position probability updates rather than the current weekly cadence. This evolution depends on consistent data sharing between clubs and the central analytics platform, a process that league officials continue to standardize.
Conclusion
Ripple maps have moved from experimental tools to core components of AFL performance forecasting. They translate daily workload spikes into quantifiable shifts in weekly and season-long position projections by combining GPS, wellness, and historical performance data. Clubs that maintain accurate inputs and apply position-specific thresholds gain clearer pictures of how training decisions influence upcoming results. As the 2026 season progresses, continued refinement of these maps promises even tighter integration between daily monitoring and long-term ladder forecasts across Australian rules football circuits.