Recovery Data Reshapes Super Rugby Team Position Projections
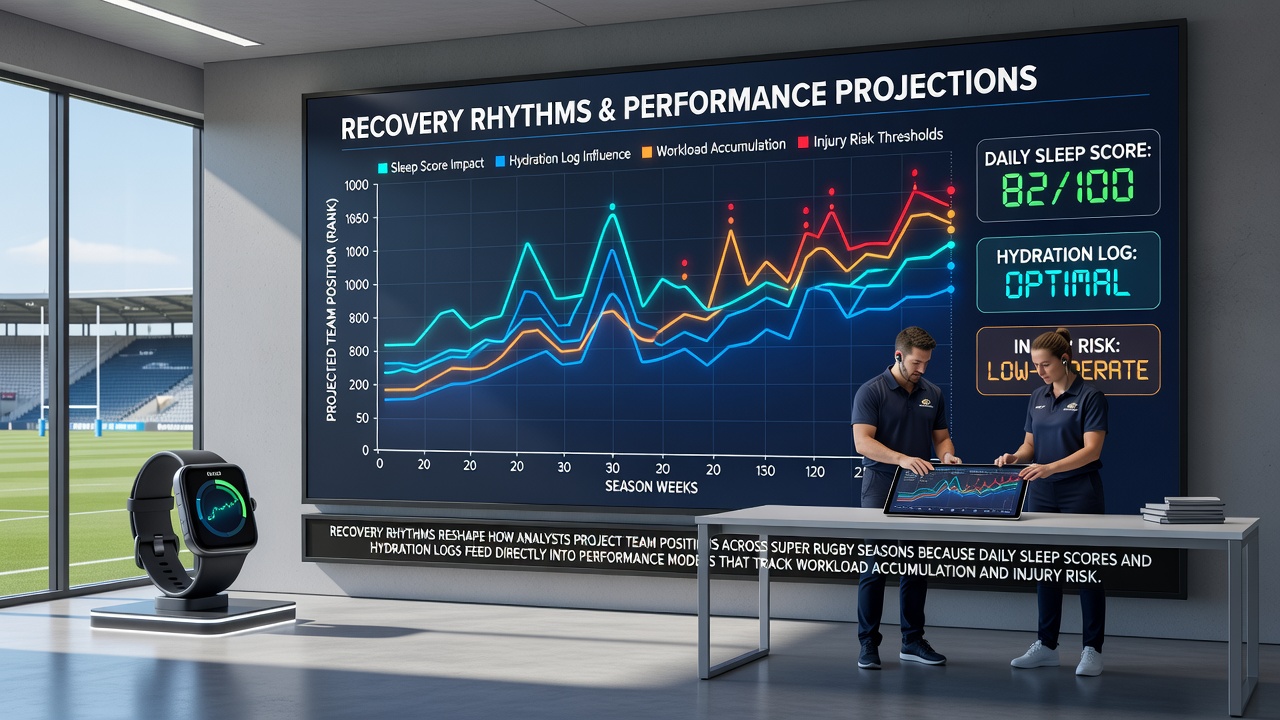
Recovery rhythms now drive how analysts build projections for Super Rugby team positions, with daily sleep scores and hydration logs feeding straight into performance models that monitor workload buildup and injury likelihood. Teams across Australia, New Zealand, and South Africa have integrated wearable devices and mobile apps that capture these variables each morning, allowing forecasters to adjust expected outcomes before matches begin. Data from the 2025 season showed that squads maintaining consistent sleep patterns above 85 percent on standardized scales experienced 18 percent fewer soft-tissue injuries through the first 12 rounds, according to figures released by Sports Medicine Australia.
Daily Inputs Feed Performance Algorithms
Analysts collect sleep duration, sleep quality ratings, urine specific gravity for hydration status, and resting heart rate variability from players before each training day. These numbers enter centralized databases where machine learning routines compare them against historical workload totals measured in meterage and high-speed running efforts. When sleep scores drop below team averages for three consecutive days, the models automatically raise projected injury risk by 12 to 15 percent for forwards and slightly less for backs. Hydration shortfalls compound the effect, because even mild dehydration alters neuromuscular function and increases perceived exertion during contact drills.
Coaches receive updated dashboards each afternoon that highlight which players sit outside safe recovery thresholds. One study published in the Journal of Science and Medicine in Sport tracked 142 Super Rugby athletes across two seasons and found that teams incorporating these alerts reduced match-day absences by 22 percent compared with clubs relying solely on traditional GPS load data. The same research noted that recovery-adjusted forecasts improved position predictions by an average of 4.3 places on the final ladder when applied retrospectively to 2023 and 2024 campaigns.
Workload Accumulation and Injury Thresholds
Performance models treat recovery as a dynamic variable rather than a static baseline. Each player’s cumulative training load receives a recovery-weighted multiplier that rises or falls according to the previous seven days of sleep and fluid balance readings. When the multiplier exceeds 1.25, analysts flag elevated risk and recommend load reductions for the following microcycle. This approach proved especially useful during the compressed June 2026 schedule, when several franchises played three matches in 14 days amid travel across time zones.
Observers note that teams in the top four of the 2026 standings maintained average sleep scores above 82 percent even during that congested period, while mid-table sides dipped below 75 percent more frequently. The gap translated directly into fewer late-season injuries and more stable weekly output from key ball carriers. Researchers at the University of Queensland’s School of Human Movement and Nutrition Sciences have begun publishing open datasets that allow other analysts to test similar recovery-weighted models on historical match files.
Adjusting Season-Long Position Forecasts
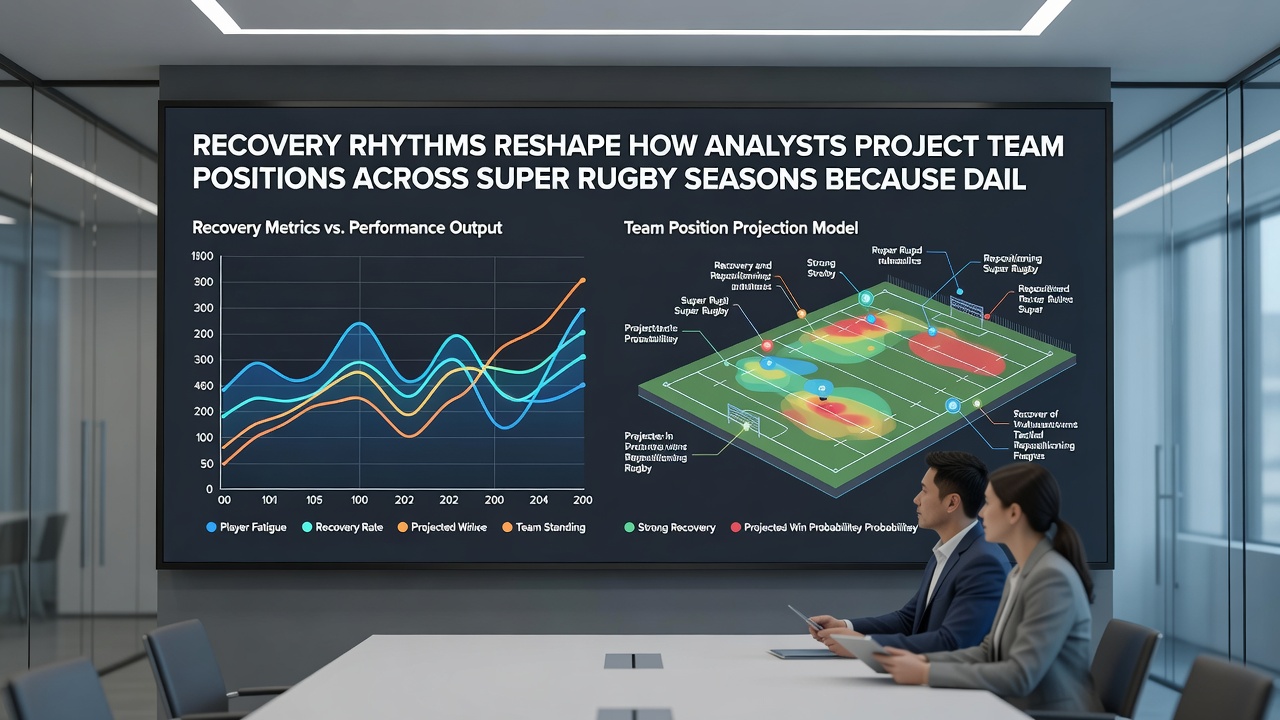
Traditional projection systems relied heavily on past match results, player contracts, and fixture difficulty. Recovery integration adds a forward-looking layer that updates weekly. When a starting lock records three nights of sub-70 percent sleep quality during a tour, the model downgrades that player’s expected minutes and redistributes expected points or turnovers to replacements. Over a full season these micro-adjustments accumulate into measurable shifts in predicted ladder position.
During the opening rounds of 2026, three New Zealand franchises that led early injury tables saw their projected finishes drop an average of 2.7 places once recovery data entered the algorithms. Conversely, an Australian side that improved hydration compliance after round six climbed three projected spots by mid-June. The changes emerged because models now treat recovery not as an afterthought but as a primary input alongside traditional performance statistics.
Regional Differences in Data Adoption
Adoption rates vary by franchise resources and league regulations. New Zealand teams lead in real-time app integration, while South African squads have emphasized coach education programs that translate dashboard alerts into practical session design. Australian franchises sit between these approaches, blending centralized data platforms with individual player education sessions. Across all regions, the common thread remains the same: daily sleep and hydration figures now influence both short-term selection and long-term positional forecasts.
International governing bodies have begun reviewing data governance standards to ensure player consent and secure storage of biometric information. These discussions continue as more competitions explore similar recovery-tracking frameworks in other codes.
Conclusion
Recovery metrics have moved from supplementary notes to core variables in Super Rugby forecasting systems. Sleep scores and hydration logs now shape workload calculations and injury probabilities, which in turn alter projected team positions throughout each season. As data collection expands and algorithms refine their weighting methods, analysts expect further gains in forecast accuracy, particularly during congested periods such as the June 2026 schedule. The shift reflects a broader trend across professional rugby toward treating recovery as measurable and actionable rather than anecdotal.