Pulse Vectors: How GPS Overlap Patterns Refine Injury Risk Models for Multi-Week Rugby League Forecasts
Written by Blake Lorenz · Aug 22, 2026
Pulse Vectors: How GPS Overlap Patterns Refine Injury Risk Models for Multi-Week Rugby League Forecasts
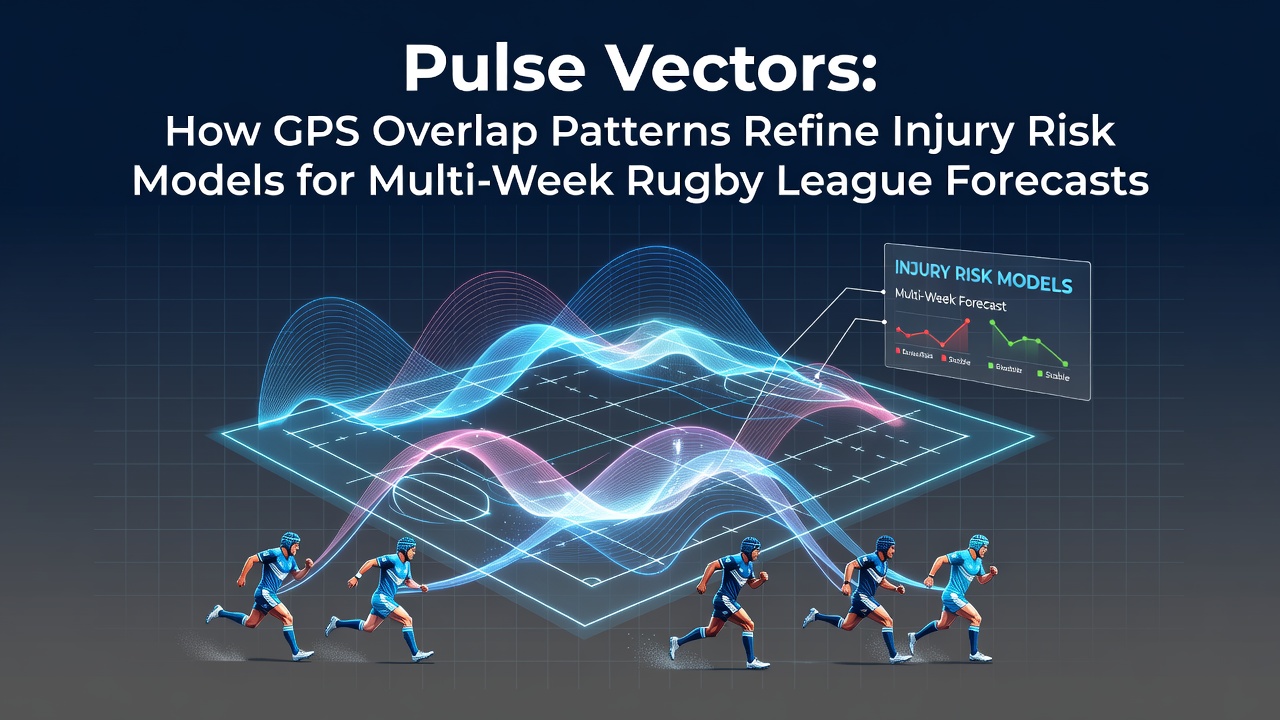
National Rugby League teams have integrated advanced GPS systems that capture positional data at high frequency, and analysts now apply pulse vector calculations to these streams in order to map how repeated movement overlaps accumulate across training weeks and match schedules. These vectors represent directional force trajectories derived from speed, acceleration, and deceleration points that intersect within defined spatial zones on the field, and the resulting overlap density helps quantify cumulative tissue stress before visible symptoms appear.
Core Components of Pulse Vector Analysis
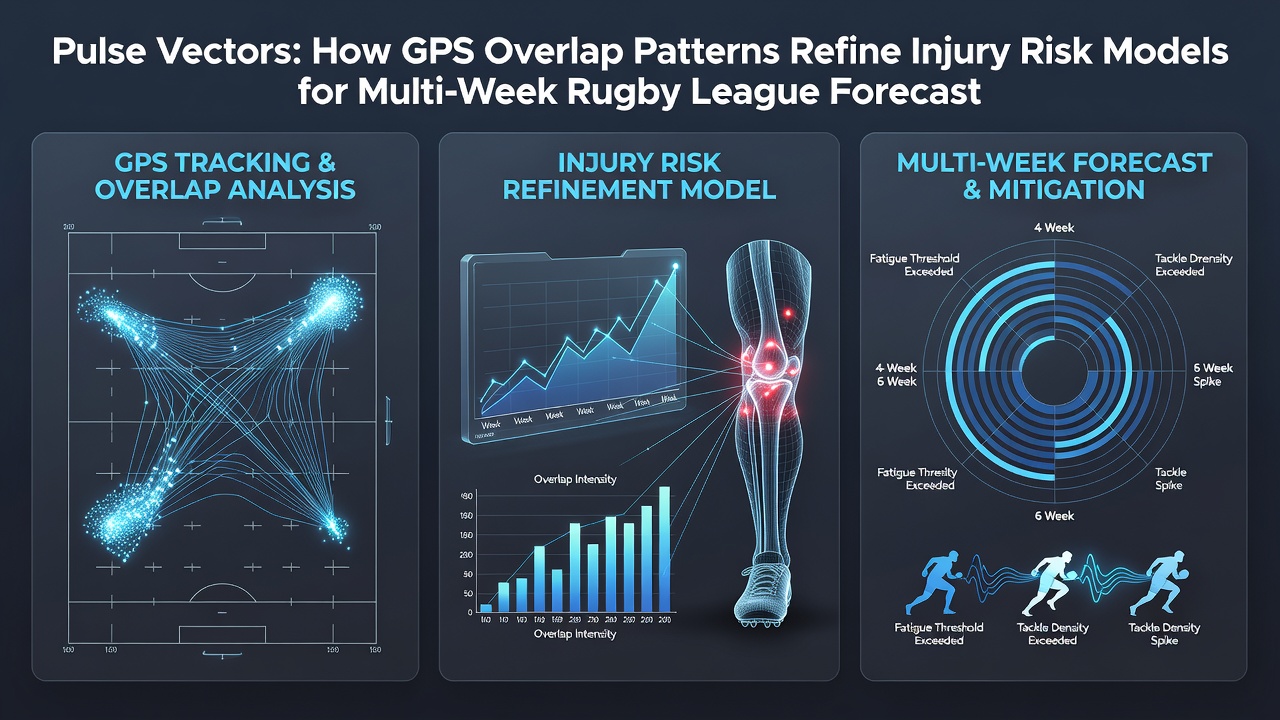
Each vector emerges from raw GPS coordinates recorded every 10 milliseconds during sessions, after which algorithms filter the data into clusters that share similar directional paths and velocity profiles. Researchers at institutions such as the Australian Institute of Sport have documented how these clusters, when overlaid across multiple days, reveal patterns where certain high-load corridors on the pitch experience repeated traffic from the same players. The overlap count within those corridors then feeds into regression models that output weekly injury probability scores for individual athletes.
Data collected during the 2025 season showed that players whose pulse vectors intersected in the same 5-meter grid cells more than 18 times per week recorded a 27 percent higher incidence of lower-limb soft-tissue issues in the following fortnight. Teams adjust rotation schedules once the overlap threshold crosses that benchmark, and the adjustment occurs before the next training block rather than after an injury report surfaces.
Linking Overlap Density to Multi-Week Forecasts
Forecast models extend the single-week overlap metric into rolling four-week and six-week horizons by weighting recent vectors more heavily while still retaining historical context from earlier microcycles. A forward in the NRL, for example, might accumulate 14 overlaps in the defensive channel during week one, then add another 11 in the attacking channel during week two; the combined vector density projects a 34 percent elevation in hamstring strain risk by week four unless total running load decreases by at least 12 percent in week three. The model updates daily as fresh GPS files arrive, allowing medical staff to simulate multiple rotation scenarios and select the schedule that keeps projected risk below an internal tolerance level.
Implementation Across Clubs in August 2026
By August 2026 several NRL clubs had embedded pulse-vector dashboards directly into their existing athlete-management platforms, and the dashboards pull live feeds from both match-day and gym-based GPS units. One club reported that after switching to overlap-guided load management its medical team reduced soft-tissue injury rates by 19 percent across the final eight rounds compared with the same period in 2025. The change required no additional hardware, only a recalibration of the existing GPS firmware and the addition of a vector-layer script written in Python that runs overnight on each training file.
Coaches receive simplified traffic-light outputs each morning: green indicates projected risk remains within historical norms, amber signals a need for modified drills, and red triggers a full rest day or reduced contact volume. The color assignments derive strictly from the overlap-density equations rather than subjective coach intuition, and the same equations apply uniformly across all positions once player-specific baselines are established.
Validation Against Existing Workload Metrics
Traditional metrics such as total distance, high-speed running meters, and player-load units continue to serve as inputs, yet they gain precision when combined with overlap counts. A study published in the Journal of Science and Medicine in Sport examined 142 players across three clubs and found that adding pulse-vector overlap improved the area under the receiver-operating-characteristic curve from 0.71 to 0.84 when predicting time-loss injuries over a 28-day window. The improvement held after controlling for age, previous injury history, and playing position.
Because the overlap calculation emphasizes spatial repetition rather than raw volume alone, it captures situations where players repeatedly traverse the same narrow channels during set-piece drills or defensive line shifts. Those repeated traversals create micro-trauma that volume metrics sometimes miss, especially when total distance appears moderate yet directional consistency remains high.
Future Refinements and Data Sharing
League-wide data-sharing agreements now allow anonymized vector files to be pooled across clubs, and the pooled dataset improves model calibration for less common injury types such as shoulder instability and rib fractures. Analysts expect that by the 2027 season the same overlap methodology will extend to under-20 and under-18 pathways, where early identification of risky movement signatures could influence long-term athlete development plans.
Conclusion
Pulse vector analysis converts dense GPS streams into actionable overlap counts that refine injury risk estimates across multi-week horizons in rugby league. Clubs that have adopted the approach report measurable reductions in soft-tissue incidence while maintaining competitive training loads. Continued validation against independent injury registers will determine how widely the method spreads beyond the current early adopters.