Pulse Echoes: Linking Recovery Biomarker Trends to Cyclist Ranking Adjustments Across Multi-Stage Grand Tours
Written by Nils Vogel · Jul 23, 2026
Pulse Echoes: Linking Recovery Biomarker Trends to Cyclist Ranking Adjustments Across Multi-Stage Grand Tours
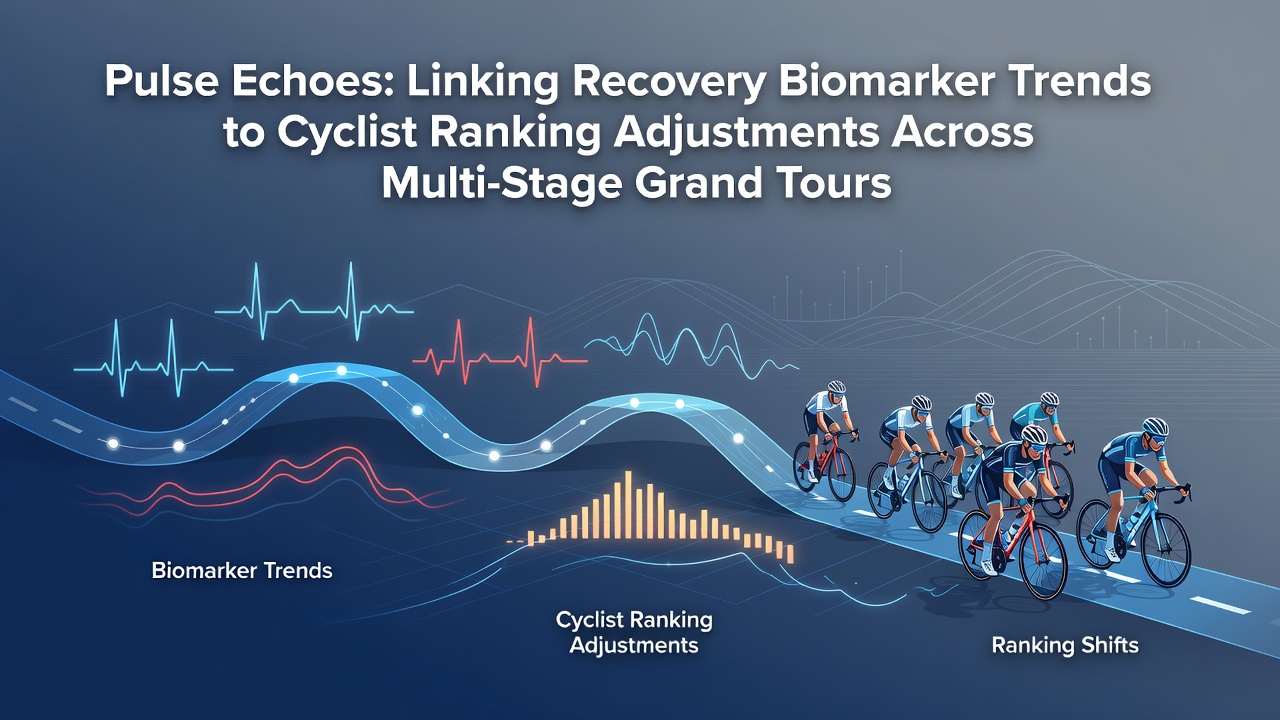
Multi-stage Grand Tours place sustained demands on athletes, and recovery biomarker trends now drive real-time adjustments to projected rankings. Teams track heart rate variability, lactate clearance rates, and salivary cortisol levels through wearable sensors that transmit data during each stage. These measurements reveal how quickly riders restore physiological balance after consecutive days of climbing and time trials.
Biomarker Monitoring Systems in Practice
Professional squads integrate continuous glucose monitors alongside overnight heart rate trackers to capture overnight recovery patterns. Research indicates that drops in nocturnal heart rate variability often precede measurable declines in next-day power output. Observers note that squads adjust pacing strategies when these signals appear, shifting domestiques into protective roles around protected leaders to preserve overall classification positions.
During the 2026 Tour de France in July, several teams applied threshold algorithms that flagged riders whose lactate clearance slowed beyond established baselines. Those adjustments altered stage tactics, moving certain athletes from aggressive breakaway attempts into controlled group finishes that protected cumulative time gaps. Data from similar events shows this approach correlates with fewer unexpected ranking shifts in the final week.
Connecting Recovery Signals to Ranking Projections
Ranking models incorporate recovery metrics as weighted variables alongside traditional stage results. When biomarker panels indicate incomplete restoration, forecasters revise expected time gaps for subsequent mountain stages. Figures from the Union Cycliste Internationale reveal that cumulative fatigue indices derived from these trends have improved the accuracy of pre-stage position forecasts by measurable margins in recent editions.
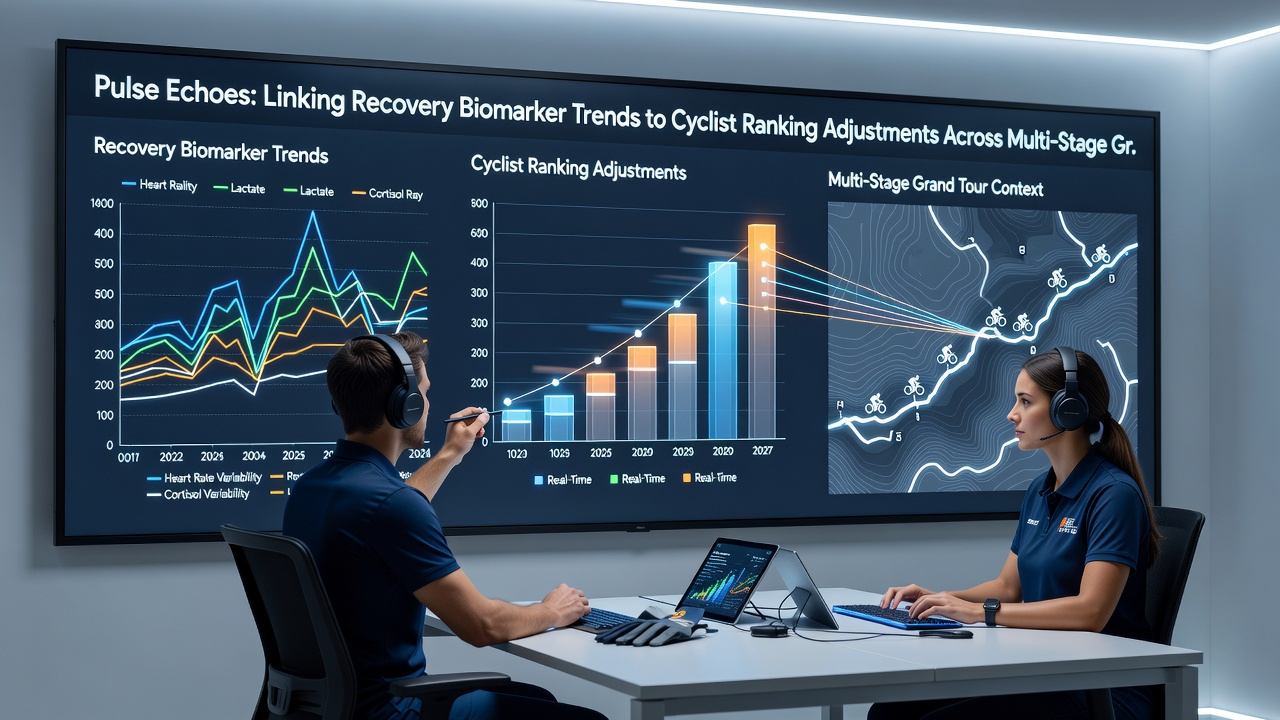
Analysts feed daily biomarker streams into longitudinal databases that compare current readings against historical rider profiles. A rider showing elevated cortisol alongside reduced variability typically receives a projected time loss buffer in models. Teams then allocate support resources differently, assigning additional nutritionists or recovery specialists to those athletes while others focus on reconnaissance for upcoming stages.
Technology Integration Across Tours
Sensor fusion platforms combine GPS-derived power data with biomarker readings to generate per-rider recovery scores. These scores feed into team dashboards that update projected general classification standings after each stage concludes. Researchers at the Australian Institute of Sport have documented how such systems help identify riders at risk of cumulative performance decay before visible drops appear in race results.
European squads often cross-reference these internal datasets with publicly available stage profiles published by race organizers. The combined view allows for dynamic re-ranking simulations that account for weather variables and course difficulty. One study revealed tighter correlations between biomarker stability and final podium positions when models incorporated both recovery trends and terrain data.
Observed Patterns in Multi-Stage Events
Patterns emerge when recovery biomarkers are tracked across the Giro d'Italia, Tour de France, and Vuelta a España. Riders who maintain consistent heart rate variability through the second week frequently hold or improve their positions relative to peers showing greater fluctuation. Teams respond by recalibrating training loads between stages, substituting high-intensity sessions with active recovery rides for flagged athletes.
Case examples from recent Grand Tours demonstrate how these adjustments influence team time trial lineups and individual stage selections. When multiple riders on the same squad display synchronized biomarker dips, directors consolidate efforts around a single leader rather than splitting resources across several classification contenders. This approach has produced measurable stability in top-ten rankings during the decisive final stages.
Future Developments in Biomarker-Driven Forecasting
Advancements in non-invasive sampling continue to expand the variables available for ranking models. Emerging salivary and sweat-based assays provide additional cortisol and inflammatory markers that teams integrate into existing frameworks. Observers expect these additions to refine projection accuracy further as more squads adopt standardized protocols across all three Grand Tours.
Regulatory bodies continue to review data privacy standards surrounding continuous biomarker collection. The approach already influences how teams allocate limited resources and how forecasters interpret daily results in the context of physiological recovery capacity.
Conclusion
Recovery biomarker trends have become embedded in the analytical processes that shape cyclist ranking adjustments throughout multi-stage Grand Tours. Continuous monitoring combined with historical comparisons delivers objective inputs that teams and analysts use to revise projections and allocate support. As sensor technology and data integration advance, these linkages will likely grow more precise while remaining grounded in measurable physiological signals.