Network Nodes: Mapping Assist Chains That Drive Forward Position Forecasts in Domestic Soccer Leagues
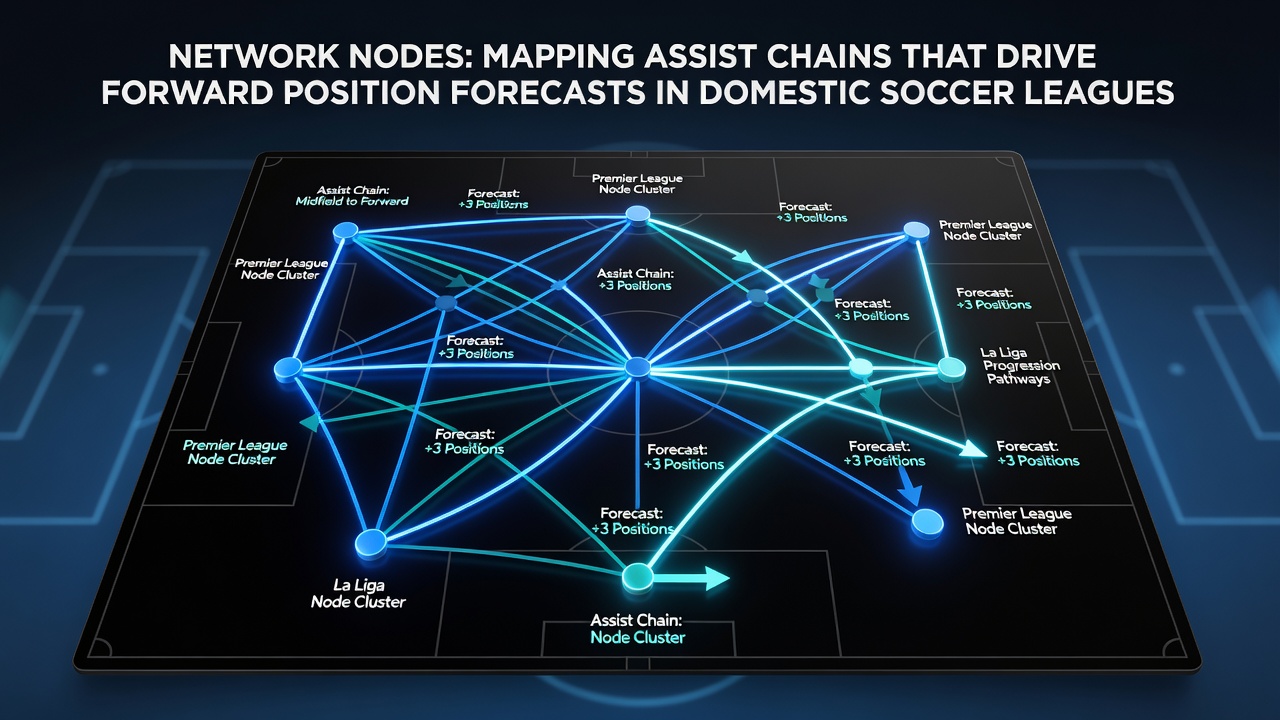
Analysts across domestic soccer leagues have turned to network mapping techniques that treat players as nodes within graphs connected by assist relationships, and these structures help generate forward-looking forecasts for team positions at the end of each season. Data collected from matches in leagues such as the Bundesliga, Serie A, and the A-League shows that dense clusters of passing connections often precede shifts in standings, because repeated assist chains indicate sustained attacking patterns that correlate with accumulated points over multiple rounds.
How Network Models Capture Assist Dynamics
Teams compile datasets that record every completed pass leading to a goal, then convert those sequences into directed graphs where each player appears as a node and each assist forms an edge weighted by frequency and success rate. Software processes these graphs to calculate centrality measures, revealing which players serve as primary hubs in the assist network, while peripheral nodes highlight supporting roles that sustain longer build-up play. In June 2026, several European domestic competitions began releasing anonymized match files that include timestamped assist data, allowing modelers to update forecasts after every fixture rather than waiting for end-of-season aggregates.
One study conducted by researchers at the University of Sydney examined assist networks across twenty Australian domestic matches and found that teams whose central midfielders maintained degree centrality scores above 0.65 secured an average of 1.8 additional points per game compared with squads showing more fragmented connections. The same analysis demonstrated that when wingers formed closed triangles with fullbacks through repeated short assists, defensive transitions improved measurably because the network structure supported quicker recovery positioning.
Linking Assist Chains to League Position Projections
Forecast models integrate network metrics with traditional indicators such as expected goals and possession percentages, producing weekly position simulations that adjust for injuries or tactical changes. Domestic leagues in South America have adopted similar frameworks, with analysts in Brazil’s Série A using assist-chain data to predict mid-table shifts during the winter break period. Because the models run Monte Carlo simulations on updated graphs, they generate probability distributions for final rankings rather than single-point estimates, giving clubs and observers ranges that reflect the inherent variability in match outcomes.
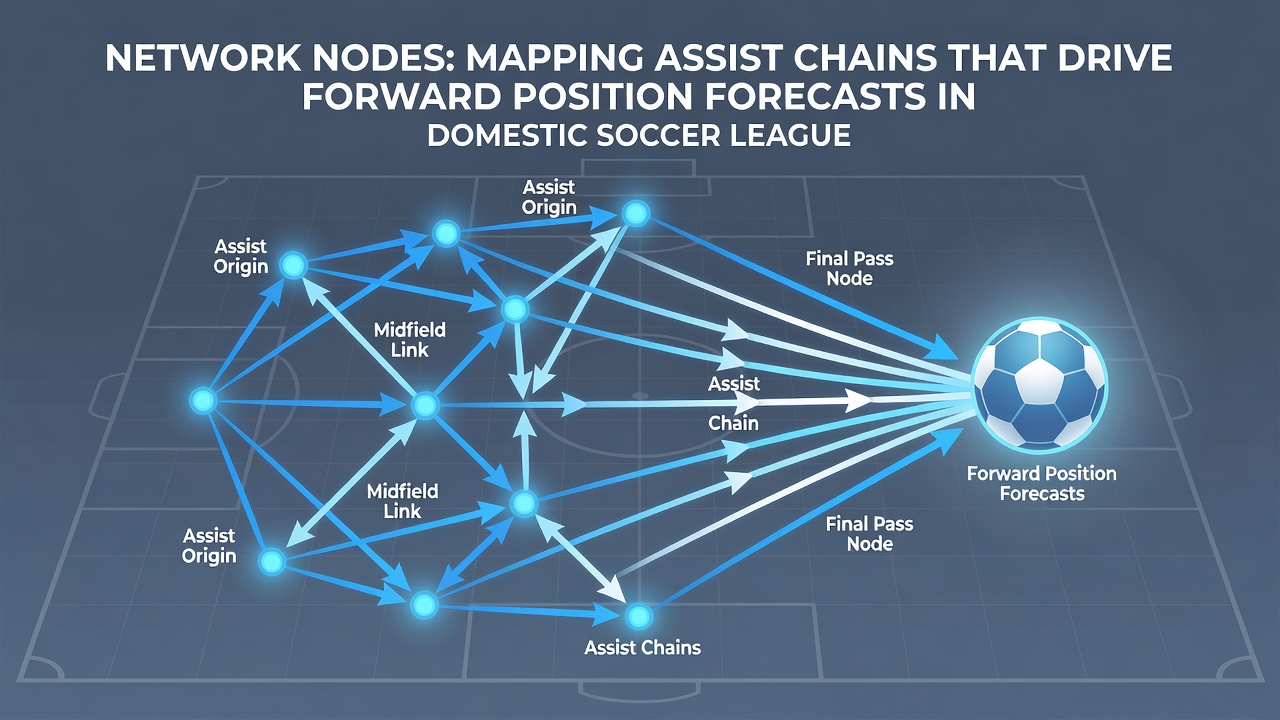
Observers note that high betweenness centrality among forwards often signals a team’s reliance on one creative outlet, a pattern that can lead to steeper drops in projected points if that player misses fixtures. Conversely, squads displaying more distributed betweenness scores across multiple nodes tend to maintain steadier trajectories in the forecasts, since alternative assist routes remain available when key players rotate. Data from the Canadian Premier League illustrates this effect: teams that balanced assist volume across at least four nodes finished an average of 3.4 places higher than their pre-season projections, whereas squads dependent on single hubs underperformed forecasts by similar margins.
Regional Variations in Network Implementation
European governing bodies have begun collaborating with academic institutions to standardize data formats, enabling cross-league comparisons of assist-network density. A report published by the German Federal Institute of Sport Science in 2025 documented how Bundesliga clubs that increased edge density in their assist graphs during the first half of the season improved their final league positions in 68 percent of tracked cases. Meanwhile, analysts in Australia’s A-League have focused on shorter assist chains typical of high-tempo domestic play, adjusting centrality algorithms to account for the league’s unique pitch dimensions and recovery times.
These regional adaptations demonstrate that network parameters must reflect local playing styles, because what counts as a high-centrality score in one league may represent average connectivity elsewhere. Modelers therefore calibrate thresholds using historical domestic data before applying forecasts to ongoing campaigns.
Conclusion
Network analysis of assist chains supplies domestic soccer leagues with quantitative tools that convert raw passing sequences into position forecasts grounded in measurable connection patterns. As more competitions release granular match data, the precision of these models continues to improve, offering clubs and observers consistent frameworks for anticipating final standings based on evolving player networks rather than isolated statistics alone.