Momentum Matrices: Cross-Referencing Opponent-Specific Stats to Enhance League Position Simulations in Ice Hockey
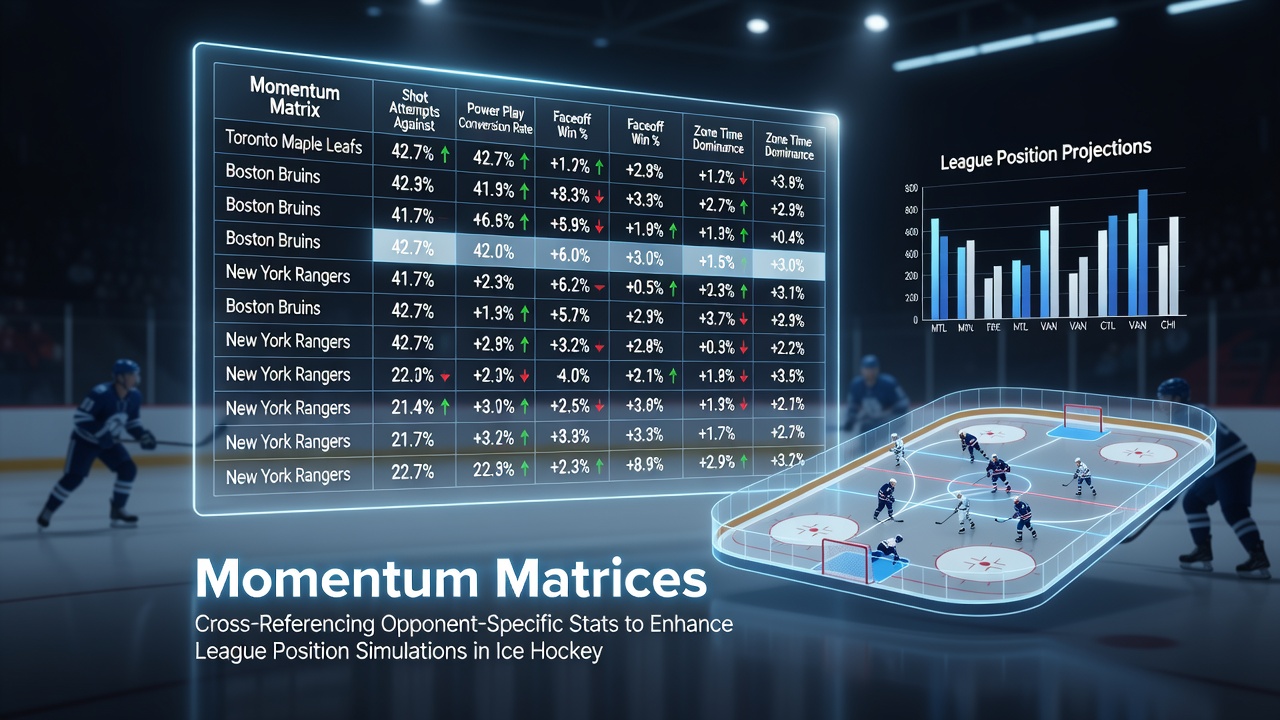
Analysts in professional ice hockey have developed momentum matrices as structured frameworks that integrate opponent-specific performance indicators with broader league data to refine simulations of team standings throughout a season; these tools draw from historical match records and real-time metrics to project how individual games influence final positions in divisions such as the NHL or international circuits governed by the IIHF.
Building the Foundation of Momentum Matrices
Researchers construct these matrices by compiling detailed statistics on how teams perform against particular opponents, including faceoff win rates, shot attempts per 60 minutes, and penalty kill efficiency, then layering in variables like travel distance and rest days to create weighted models that adjust for context-specific factors; data from leagues tracked by organizations such as Statistics Canada shows that such cross-referencing improves the accuracy of position forecasts by accounting for matchup histories that standard averages overlook.
Teams compile rows and columns in these matrices where each entry represents a normalized value derived from multiple seasons of play, allowing simulators to run thousands of Monte Carlo iterations that generate probable outcomes for remaining fixtures while factoring in the ripple effects of recent results on team confidence and line chemistry.
Integrating Opponent-Specific Data Streams
Cross-referencing begins with granular breakdowns that isolate performance against divisional rivals versus non-conference teams, because evidence from league archives indicates that certain clubs maintain elevated scoring rates when facing familiar opponents due to tactical familiarity built over repeated encounters; analysts feed these differentiated stats into algorithms that adjust base probabilities, resulting in simulations that reflect realistic variance rather than uniform league-wide assumptions.
Additional inputs include advanced tracking from wearable sensors and puck-tracking systems deployed across North American and European rinks, which capture speed differentials and zone entry success rates tailored to each adversary's defensive structure, thereby enhancing the matrix's ability to model how momentum shifts during extended road trips or back-to-back scheduling clusters common in winter schedules.
Refining League Position Simulations
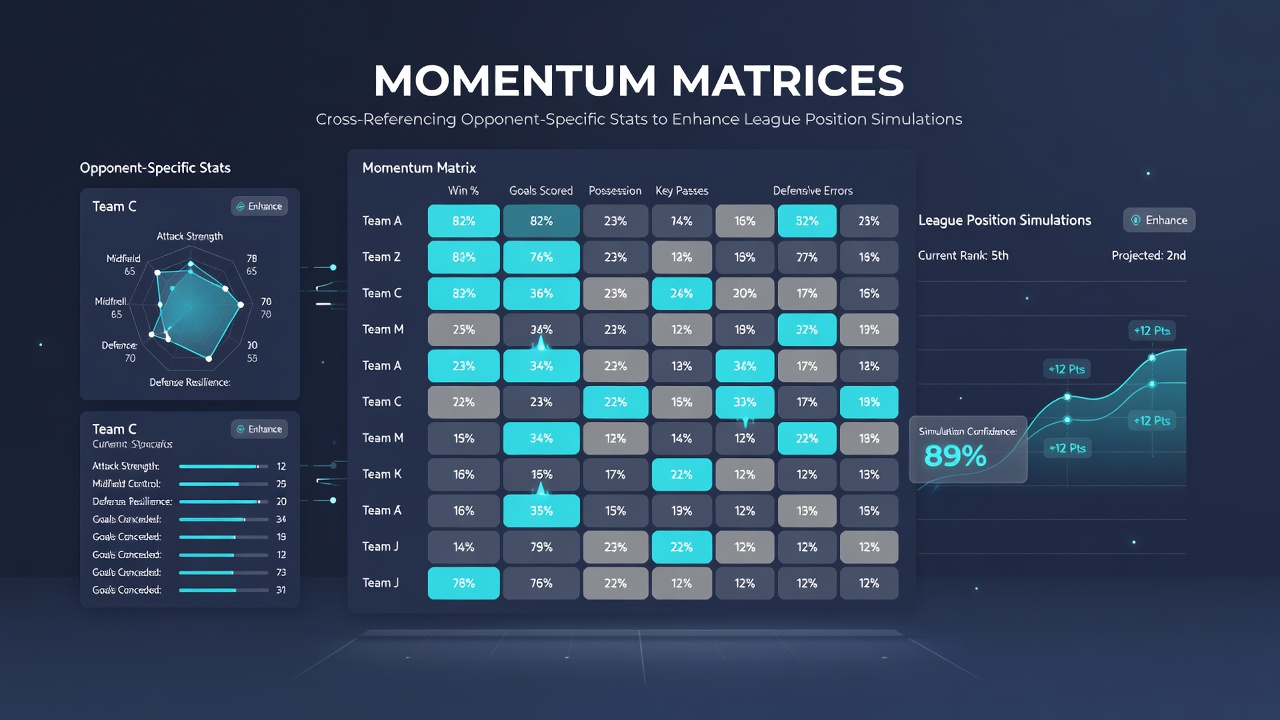
Simulations powered by momentum matrices operate by propagating updated values through the season calendar, recalibrating projected point totals after each completed game and incorporating opponent-adjusted trends to forecast playoff qualification thresholds or relegation risks in multi-tiered systems; figures from academic reviews of sports modeling indicate these methods reduce mean absolute error in end-of-season rank predictions compared to baseline regression approaches that ignore head-to-head nuances.
During July 2026 off-season periods, analysts revisit full-season datasets to recalibrate matrix weights ahead of training camps, incorporating summer developments such as roster trades and rule adjustments announced by governing bodies to ensure simulations for the upcoming campaign start with the most current opponent profiles available from international competitions held earlier that year.
Case examples from European leagues demonstrate how matrices highlighted overlooked patterns, such as elevated turnover rates for certain squads when matched against high-pressure forechecking styles, which in turn allowed forecasters to generate more precise divisional standings ranges that aligned closely with actual outcomes observed in subsequent months.
Applications Across Professional Circuits
Coaching staffs and front offices apply these matrices not only for standings projections but also for tactical preparation, by identifying statistical clusters where specific line combinations historically outperform given opponents and then testing those combinations through simulation runs before actual matchups occur; this process draws on comprehensive databases maintained by entities like the NHL and equivalent bodies in Sweden and Finland to maintain cross-league comparability.
What's interesting is how the integration of daily workload data and injury reports further refines matrix entries, creating dynamic updates that reflect real-time roster availability while preserving the core opponent-specific weighting that distinguishes this approach from generic predictive tools.
Conclusion
Momentum matrices continue to evolve as analysts incorporate emerging data sources from global ice hockey events, resulting in simulations that provide clearer views of how localized performance trends aggregate into season-long league positions; organizations that maintain these systems report consistent gains in forecast reliability across multiple campaigns, underscoring the value of detailed cross-referencing when modeling competitive outcomes in this fast-paced sport.