Momentum Maps: Tracing How Travel Fatigue Accumulates and Reshapes Team Rankings Across Transcontinental Basketball Tours
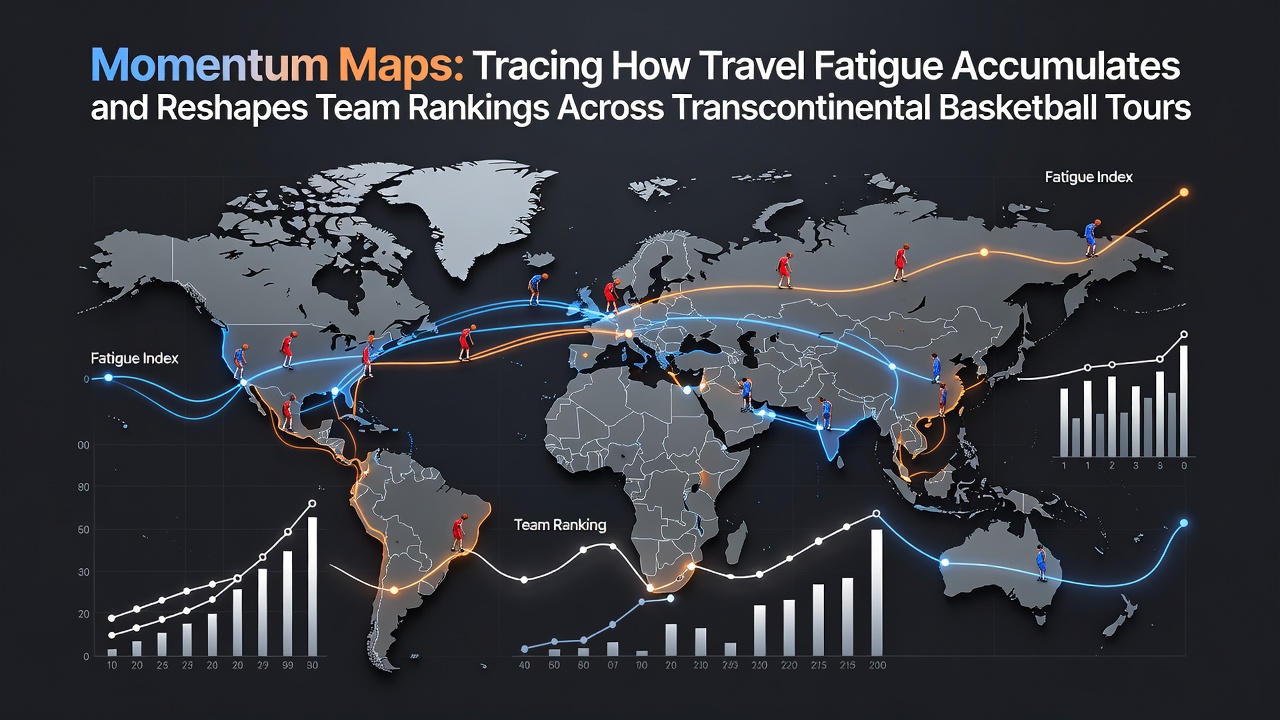
Travel across multiple time zones disrupts sleep cycles and physical recovery in athletes, while momentum maps provide a structured way to quantify these shifts and their influence on team standings during extended basketball tours. Researchers at sports science institutions track variables such as sleep duration, circadian misalignment, and game-to-game recovery intervals to build these maps, which then illustrate how initial performance advantages erode as tours progress through continents.
Mapping the Buildup of Fatigue Across Routes
Data from longitudinal studies show that teams flying from North America to Asia experience an initial 48-hour adjustment period where shooting accuracy and defensive reaction times decline by measurable percentages before stabilizing, and subsequent legs to Europe compound these effects through further schedule compression. Observers note that momentum maps capture this accumulation by layering daily workload metrics onto ranking algorithms, revealing patterns where early leaders drop several positions after crossing the international date line twice within a single month.
Analysts integrate heart rate variability readings and session rating of perceived exertion scores into these visualizations, which helps forecast when cumulative fatigue will alter projected outcomes in tournament brackets. In July 2026 several transcontinental events are scheduled that will test these models further as squads navigate dense flight itineraries between North American training camps and Asian exhibition series before returning westward.
Performance Metrics and Ranking Adjustments
Teams that maintain consistent recovery protocols demonstrate smaller deviations in momentum map trajectories compared with those relying on standard travel schedules, according to aggregated data compiled by international basketball federations. Velocity thresholds for player movements drop noticeably after the third consecutive long-haul flight, and these reductions feed directly into updated league position forecasts that account for both offensive efficiency and rebounding percentages.
One study released by the Australian Institute of Sport examined similar multi-stage travel demands in endurance sports and found parallel declines in power output that lasted up to five days after arrival, providing a reference framework now adapted for basketball analytics. Researchers apply these insights to create ripple maps that trace how individual player fatigue influences collective team rankings rather than isolating single-game results.
Case Examples from Recent Tours
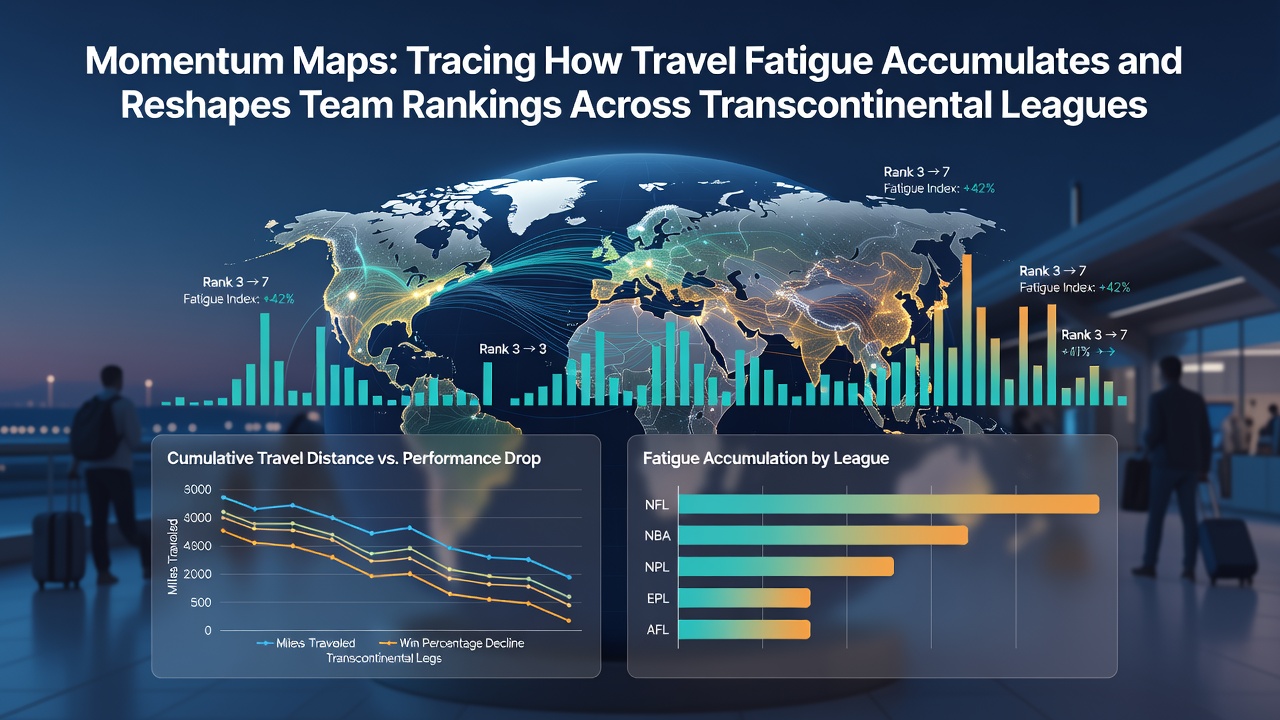
During a documented 2025 tour spanning the United States, Japan, and Spain, one North American squad saw its projected playoff seeding slip four spots after analysts updated momentum maps with post-travel biometric data showing elevated cortisol levels and reduced sleep efficiency. Similar adjustments occurred when European teams crossed into South American venues, where altitude combined with time-zone shifts produced steeper downward curves in the visualizations.
These documented cases demonstrate how external factors such as flight duration and layover frequency interact with internal recovery capacity to reshape standings without requiring subjective interpretation. Organizations including the International Olympic Committee have published guidelines on managing circadian disruption that feed into the same data pipelines used for ranking projections.
Future Applications in Scheduling and Forecasting
League officials now incorporate momentum map outputs when constructing future transcontinental calendars, adjusting rest periods between games based on predicted fatigue accumulation curves derived from historical datasets. Universities in both Canada and Germany have contributed peer-reviewed models that refine these forecasts by factoring in individual athlete age, prior travel exposure, and positional demands specific to basketball.
Continued refinement of sensor fusion techniques promises greater precision in identifying the exact points where fatigue begins to override skill advantages, allowing rankings to reflect real-time physiological states rather than static season averages alone. Such developments keep the focus on measurable performance trajectories across expanding global schedules.
Conclusion
Momentum maps supply an objective framework for tracing the progressive impact of travel fatigue on basketball teams engaged in transcontinental competition, connecting biometric indicators directly to shifts in league standings. As events unfold through July 2026 and beyond, these tools will continue integrating new data streams to maintain accurate representations of how accumulated demands reshape competitive hierarchies across continents.