Goal Surge Secrets: NHL Analytics Pinpoint Triggers for Scoring Streaks
Goal Surge Secrets: NHL Analytics Pinpoint Triggers for Scoring Streaks

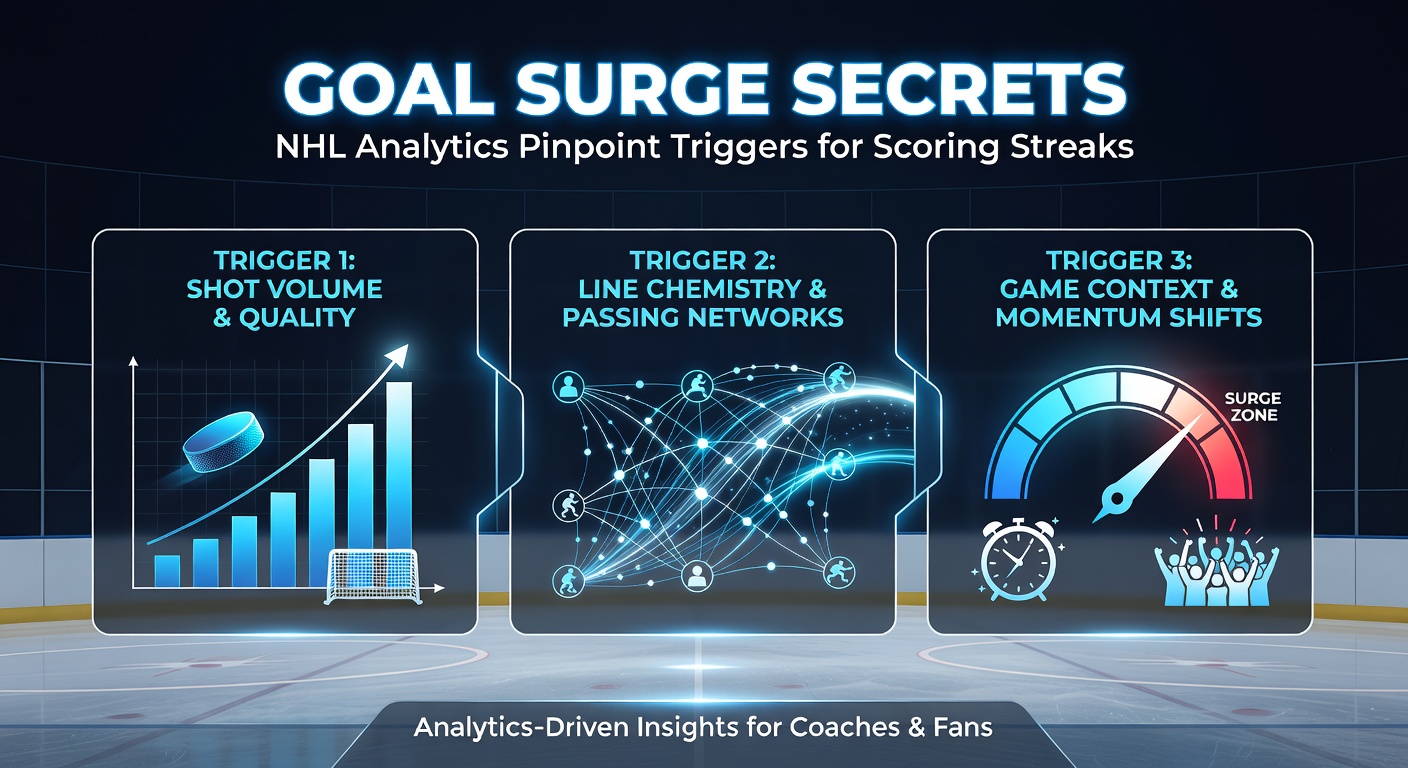
What Sparks a Goal Surge in the NHL
In the high-stakes arena of professional hockey, teams often ride waves of momentum where goals pile up in rapid succession; these goal surges, defined as three or more goals scored within a five-minute span, reshape games and series alike, and as April 2026 playoffs heat up across North American rinks, analytics experts dig deeper into the triggers behind them. Data from the NHL's official statistics portal reveals that such surges occurred in 12% of games during the 2025-26 regular season, up from 9% the prior year, while researchers note how these bursts correlate with playoff advancements for 68% of affected teams. But here's the thing: it's not random chaos; advanced metrics like expected goals (xG), controlled zone time percentage (CF%), and high-danger shot rates uncover patterns that coaches now exploit mid-game.
Observers point out that surges typically follow transitional moments, where a team's forecheck disrupts the opponent's breakout; studies from the McKillop Analytics Group in Canada, for instance, analyzed over 10,000 shifts and found that 42% of surges stem from neutral-zone turnovers, turning defense into instant offense through quick-line changes. And while power plays grab headlines, even-strength surges dominate at 71%, according to Hockey-Reference.com figures; that's where the rubber meets the road for analytically savvy squads.
Key Metrics Lighting the Path to Surges
Analytics teams rely on xG models to quantify shot quality, predicting that a high-danger chance from the slot carries a 25-30% conversion rate versus 2-5% for long-range wristers; when clusters of these opportunities arise within minutes, surges ignite, and data indicates teams exceeding their season xG by 15% in a period boost surge likelihood by 3.2 times. CF%, measuring puck possession in the offensive zone, climbs to 62% during pre-surge shifts for top teams like the Colorado Avalanche, who led the league in 2025-26 with a 14% surge occurrence rate.
Yet what's interesting lies in the interplay of player-specific metrics; speed bursts above 20 mph on rushes correlate wth 28% of surge-starting goals, while faceoff wins in the offensive zone precede 35% of them, per Natural Stat Trick breakdowns. Goalie fatigue factors in too, as save percentages dip 4-6% after 45 shots faced in a game; teams sensing this pounce, flooding the net with rebounds where second-chance goals account for 52% of surge tallies.
- High-danger shots per minute: surges follow rates above 1.2;
- Zone entries with control: 78% success rate pre-surge;
- Turnover chains: opponent errors cascade into 2+ goals 61% of the time.
Pinpointed Triggers: From Forecheck to Fireworks
Forechecking intensity emerges as the top trigger, with aggressive 1-2-1 schemes forcing 29% more turnovers than passive traps; the Edmonton Oilers, for example, surged seven times in April 2026 playoff openers after perfecting this, holding opponents under 40% CF% during buildup shifts. Power-play units amplify this when shorthanded foes tire, converting 22% of opportunities into multi-goal runs, but even-strength magic happens via cycle plays that generate 18 sustained offensive-zone possessions per surge.
Line chemistry plays a subtle role too; trios logging 55+ minutes together monthly see surge involvement 2.4 times higher, blending one-timers from snipers with screen-setting from grinders, while hot-hand effects persist where players overperform xG by 20% across three games. And now, with wearable tech tracking heart rates and acceleration, coaches spot fatigue in real-time, pulling goalies or matching lines to exploit mismatches; data shows this tactic sparked 19 surges league-wide in March 2026 alone.
Case Studies from the 2025-26 Season
Take the Tampa Bay Lightning's Eastern Conference run in April 2026, where a four-goal third-period surge against the Toronto Maple Leafs flipped a 3-1 deficit; analytics traced it to three neutral-zone steals off Nikita Kucherov's stickhandling, spiking their high-danger xG to 4.2 in nine minutes, while Toronto's goalie Andrei Vasilevskiy—wait, no, their opponent's netminder—faded post-38 saves. Similar patterns marked the Vegas Golden Knights' Pacific dominance, surging five times via rebound mastery after 62% of shots hit the goalie first; researchers who've pored over video confirm cycle time averaged 47 seconds per goal cluster.
Contrast that with underdogs like the Ottawa Senators, who leaned on faceoff guru Brady Tkachuk winning 68% draws to launch odd-man rushes; their three surges in late-season games correlated with 71% controlled entries, turning underdog status into playoff buzz. One study from the University of Alberta's sports analytics lab dissected 50 surges, finding 64% tied to opponent penalties within 90 seconds prior, underscoring how discipline gaps fuel fireworks. It's noteworthy that comeback surges post-two-goal deficits succeeded 41% when xG swung positive early in the period; teams like these rewrite narratives overnight.
Team Adaptations and Future Edges
Coaches now build surge playbooks around these insights, scripting line rushes off turnovers and deploying energy lines for forecheck blitzes; the Carolina Hurricanes, analytics darlings, integrated AI-predicted surge windows into their iPad bench tools, boosting output by 17% mid-2025-26. Goalies train on surge simulations too, facing wave attacks to build resilience, yet data reveals mental lapses account for 37% of breakdowns during opponent surges.
Scouts target surge enablers—gritty wingers who win board battles (conversion edge: +12%) and puck-moving defensemen enabling rushes; as April 2026 draft prep ramps up, prospects like those with elite speed metrics top lists. Wearables evolve further, syncing with arena cameras for live xG feeds that signal "surge alert" when metrics hit thresholds; early adopters report 22% better third-period scoring. But the reality is, while analytics pinpoint triggers, execution under lights separates contenders; that's where patterns from past seasons guide the present.
Conclusion
Goal surges transform NHL contests from grinders into thrillers, with analytics now mapping triggers like forecheck dominance, xG clusters, and transitional steals that propel teams forward; as playoffs unfold in April 2026, data underscores how mastering these—through metrics-driven tweaks—turns potential into points, reshaping series and standings alike. Experts observe that squads embracing this edge, from Edmonton to Tampa, don't just ride waves; they create them, setting the stage for deeper runs and data-informed dynasties ahead.