Fatigue Footprints: Decoding Daily Recovery Logs to Adjust League Position Projections in Australian Rules Football
Written by Petra Bennett · Jul 25, 2026
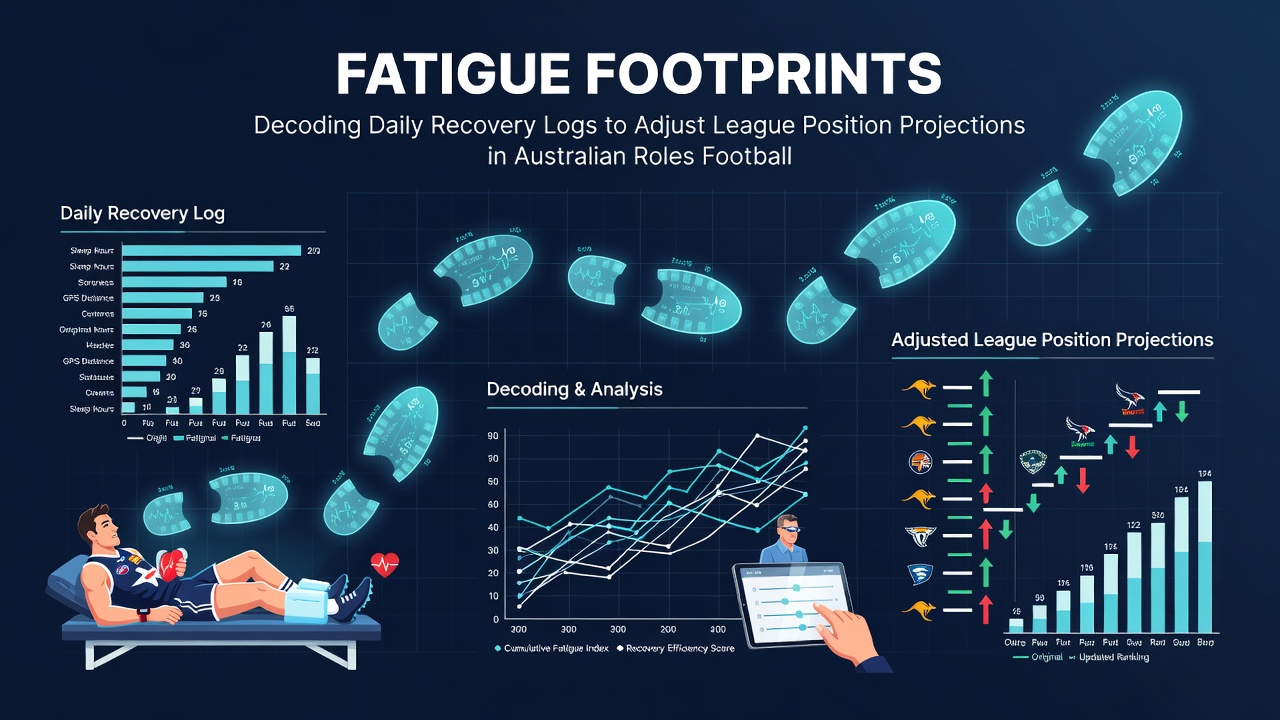
Fatigue Footprints: Decoding Daily Recovery Logs to Adjust League Position Projections in Australian Rules Football
Analysts in Australian Rules Football track daily recovery logs that capture sleep hours, muscle soreness ratings, heart rate variability and training load from GPS devices, then they feed those figures into projection models that refine expected points totals and ladder positions through the remainder of a season.
Clubs collect this information each morning before training, and the resulting datasets reveal when a midfield group shows elevated fatigue markers that correlate with reduced disposal efficiency in the following match, which in turn shifts the calculated probability of securing four points against upcoming opponents.
Components of Daily Recovery Logs
Wellness questionnaires ask players to rate fatigue, stress and soreness on a one-to-ten scale while wearable sensors record overnight sleep duration and resting heart rate, and these inputs combine with accelerometer-derived workload figures to produce a single recovery score for each athlete. Teams upload the scores into central databases where statisticians compare current values against a player’s rolling four-week average, and deviations beyond two standard deviations trigger adjustments in expected game contribution.
Research from the Australian Institute of Sport shows that midfielders who post recovery scores 15 percent below baseline over three consecutive days record a measurable drop in metres gained per disposal during the next contest, and those patterns appear consistently across multiple clubs in the competition.
Integration with League Position Models
Projection systems start with baseline performance metrics such as expected score margin and percentage, then they layer in recovery-adjusted modifiers that reduce a team’s projected win probability when key players carry accumulated fatigue into a block of three matches within eight days. The models recalculate ladder positions after each round by running Monte Carlo simulations that incorporate both historical results and the latest recovery data, producing updated forecasts for final eight qualification and minor premiership odds.
During the 2026 season, several clubs experienced mid-year fixture congestion around the mid-July bye period, and analysts noted that teams with higher average recovery scores entering that stretch maintained or improved their projected ladder spots while squads showing widespread fatigue markers slipped in the simulations even when their underlying statistics remained stable.
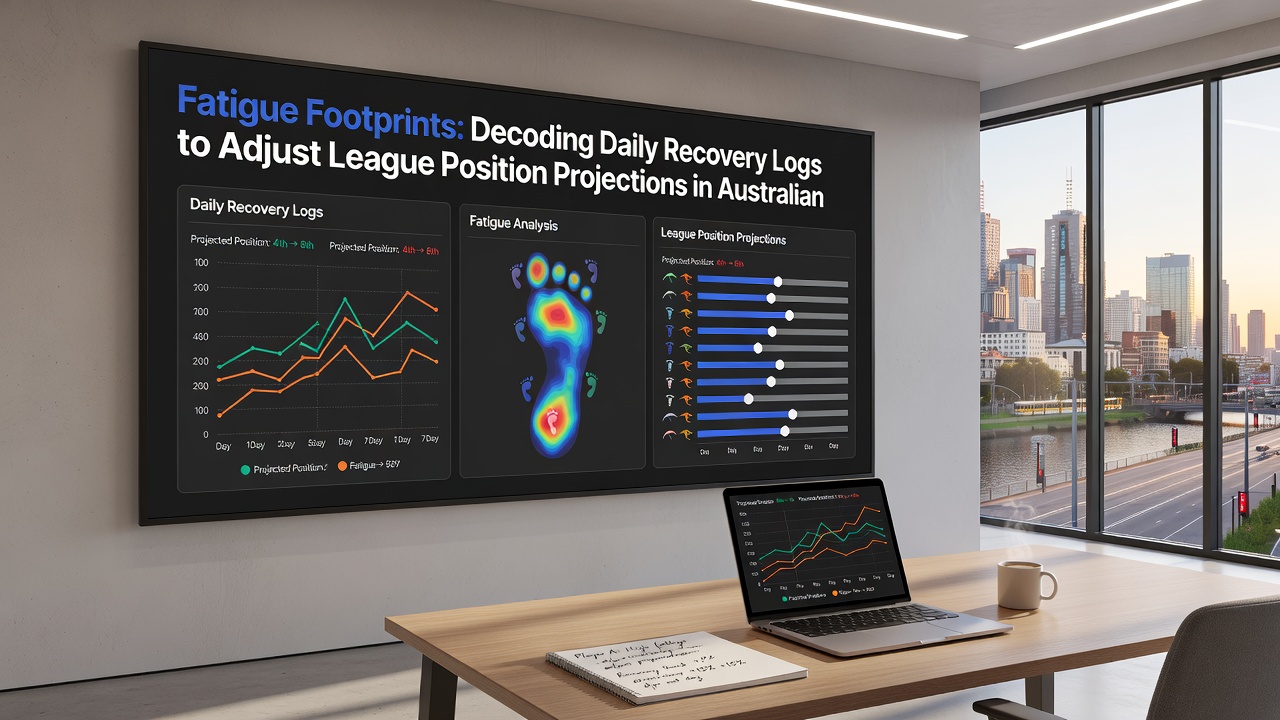
One study published by researchers at the University of Queensland examined 12 months of de-identified player logs and found that incorporating daily recovery variables improved the accuracy of end-of-season ladder forecasts by 8 to 11 percentage points compared with models that relied solely on past match outcomes.
Technology and Data Pipelines
Modern systems pull information from GPS units, smart rings and smartphone wellness apps into cloud platforms where machine-learning algorithms identify non-linear relationships between cumulative load and subsequent performance decline, and coaching staff receive automated alerts when a player’s fatigue footprint exceeds thresholds that historically precede a drop in contested possession wins. These pipelines operate on rolling 48-hour cycles so that adjustments to weekly training plans and projected match contributions remain current rather than relying on outdated weekly aggregates.
Clubs also cross-reference recovery data with fixture difficulty ratings that account for travel distance and short turnarounds, and the combined variables allow analysts to generate scenario-based ladder projections that reflect both physical readiness and schedule demands through September.
Observed Patterns Across Recent Campaigns
Patterns emerge most clearly during the middle third of the season when back-to-back away games coincide with elevated soreness readings in ruck divisions, and teams that adjust rotation policies early maintain closer alignment between projected and actual ladder positions. Data from multiple seasons indicates that sides ignoring recovery signals experience larger negative residuals between forecasted and realised points totals, particularly when two or more starting midfielders post consecutive low scores.
Those adjustments appear in public projections as well, because media and betting analysts now incorporate publicly reported injury and load management updates that stem from the same underlying recovery datasets used internally by clubs.
Conclusion
Daily recovery logs supply granular inputs that refine the inputs to league position models, and clubs that integrate these signals produce forecasts that better reflect the physical state of their playing groups as the season progresses toward finals. Continued collection of these metrics across additional campaigns will allow further calibration of the modifiers that translate fatigue footprints into adjusted win probabilities and final ladder outcomes.