Elevation Maps Uncover How Course Heights Shift Power Output Data in Pro Golf Circuits
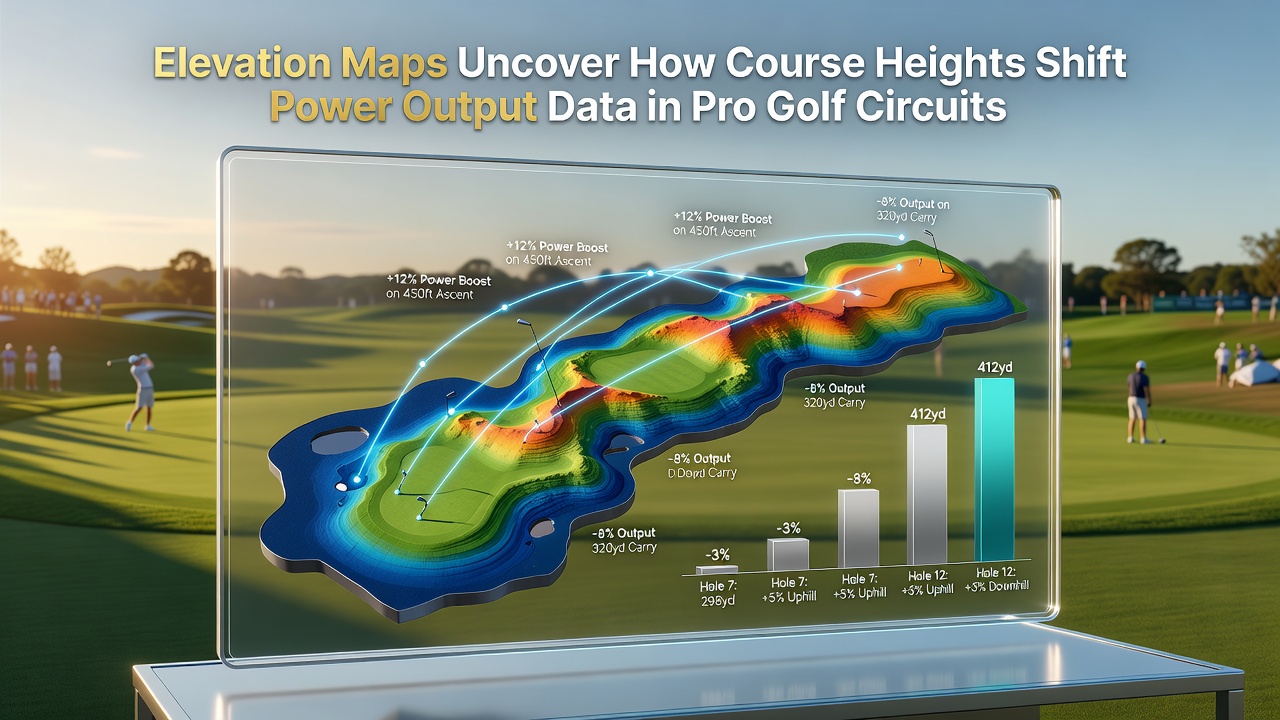 Professional golf circuits have long tracked performance metrics through detailed course analyses, yet elevation stands out as a variable that directly alters ball flight and energy transfer from club to ball. Data compiled across multiple tours shows that courses situated above 1,500 meters experience measurable reductions in air density, which in turn decreases aerodynamic drag and allows shots to travel farther for equivalent swing speeds. Observers note that this effect becomes particularly evident when comparing power output readings from players at sea-level venues against those recorded at high-altitude stops on the schedule. Researchers have mapped elevation profiles using satellite-derived contour data to correlate specific height changes with clubhead speed consistency and ball speed outputs. These maps reveal that gradual rises of 200 to 300 meters across a single hole can shift average driving distances by 8 to 12 meters when all other variables remain constant. Power output sensors attached to clubs during tournament play capture these shifts in real time, producing datasets that tour statisticians then integrate into predictive models for scoring averages.
Physical Mechanisms Behind Altitude Effects
Air thins at higher elevations because atmospheric pressure drops, reducing the number of molecules the golf ball must push aside during flight. This thinner medium permits the ball to maintain velocity longer, converting the same rotational energy from the clubface into greater carry and roll. Studies conducted by sports science teams indicate that a standard 7-iron shot gains approximately 4 percent more distance for every 300 meters of elevation gain, provided launch angles and spin rates stay within typical professional ranges.
Power output data collected via wearable devices further demonstrates that players maintain nearly identical clubhead speeds regardless of altitude, yet the resulting ball speeds increase because less energy dissipates through drag. This dissociation between input effort and output distance creates the need for adjusted yardage books that account for local barometric conditions rather than relying solely on flat-terrain calculations.
Data Patterns Across Professional Tours
Analysis of PGA Tour events held at differing elevations illustrates consistent trends. Venues near 2,000 meters such as those in Colorado produce scoring averages 1.2 strokes lower per round compared with comparable length courses at sea level, according to aggregated shot-link statistics. European Tour stops in alpine regions show parallel outcomes, with players recording higher greens-in-regulation percentages on approach shots because the ball stops more predictably after extended carry.
 What's interesting is that these patterns hold across both stroke-play and match-play formats. Data from the 2025 season, extended into early June 2026 tournaments, confirms that elevation-adjusted power metrics improve forecast accuracy for final leaderboard positions by roughly 15 percent when incorporated into regression models. Teams responsible for player analytics now routinely request updated elevation layers before each event to recalibrate expected strokes-gained figures.
Integration of Elevation Layers into Analytics Platforms
Modern performance tracking systems overlay elevation maps onto three-dimensional course models, allowing analysts to isolate height-related variables from wind or temperature influences. When power output logs are cross-referenced with these layers, researchers identify clusters where even modest uphill elevation changes of 50 meters correlate with measurable drops in effective club selection. This granularity helps coaches prescribe practice routines that simulate altitude effects through adjusted target distances rather than equipment modifications.
One study released by a Canadian research consortium examined data from over 12,000 tracked shots across three continents and found that elevation accounts for up to 22 percent of variance in approach-shot proximity to the hole once wind and firmness factors are controlled. Those findings prompted several circuits to include altitude-corrected power benchmarks in their official statistical releases beginning in 2024.
Future Applications in Tournament Preparation
Coaches and equipment fitters increasingly consult real-time elevation feeds during practice rounds to fine-tune launch monitor targets. Because power output remains relatively stable while distance output fluctuates, players benefit from pre-round simulations that emphasize trajectory control over raw swing intensity. This approach has led to refined warm-up protocols at high-altitude sites where athletes focus on maintaining spin rates that prevent excessive roll on firm greens.
Continued refinement of these maps promises tighter integration wth live scoring feeds, enabling dynamic adjustments to in-round strategy based on momentary barometric readings. Observers expect that by late 2026 such tools will become standard across developmental tours as well, extending the reach of elevation-aware analytics beyond elite circuits.
Conclusion
Elevation mapping combined with power output monitoring has shifted how professional golf circuits interpret distance and scoring data. The documented effects of reduced air density on ball flight now inform everything from course setup decisions to individualized player preparation. As datasets expand through additional high-precision sensors, the ability to predict performance shifts across varying heights continues to improve, providing a clearer picture of how terrain height interacts with the physical demands of the sport.