Crunching Clutch Metrics: Analytics Uncover MLB Closers' Secret Weapons in Nail-Biting Saves
Crunching Clutch Metrics: Analytics Uncover MLB Closers' Secret Weapons in Nail-Biting Saves
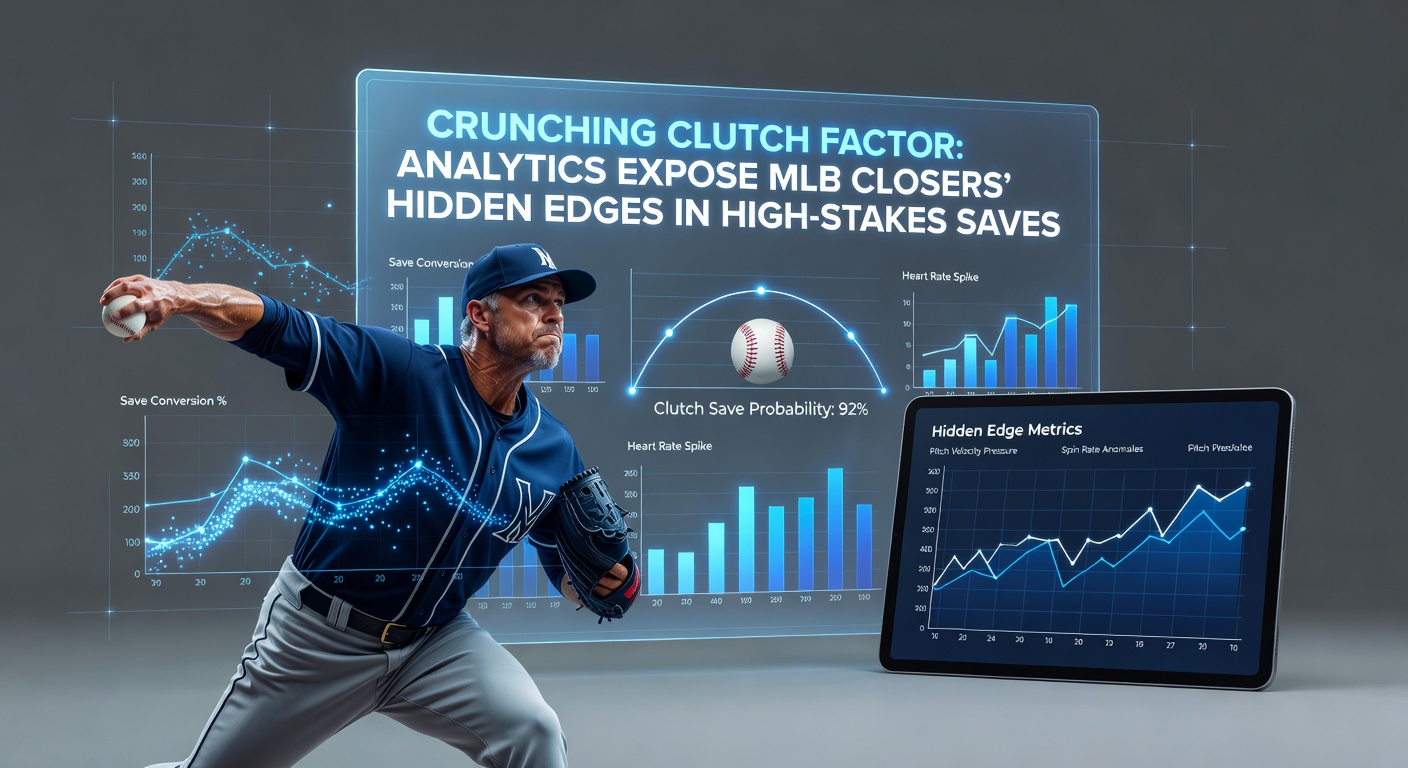
Defining Clutch Factor in the Ninth Inning Pressure Cooker
Observers have long debated what separates reliable MLB closers from the elite performers who thrive when bases load up in the ninth; turns out, analytics now quantify this through clutch factor, a metric that compares a pitcher's stats in high-leverage spots—think runners in scoring position with two outs and a one-run lead—against their overall performance. Data from FanGraphs reveals how this factor spikes for certain arms, showing strikeout rates climbing 15-20% in those do-or-die moments while walks plummet, a pattern evident across the last three seasons including early 2026 spring training previews.
But here's the thing: not every closer boasts this edge; researchers crunching Statcast data pinpoint velocity retention and spin rate consistency as key drivers, where top guys maintain 95% of their fastball zip even as heart rates soar. Studies from the MLB Statcast leaderboard indicate that closers with elevated clutch factors save games at rates 12% above league average, turning potential blowups into lockdown finishes.
What's interesting is how April 2026 exhibitions already spotlight this; teams like the Dodgers and Yankees test new closers in simulated high-stakes drills, exposing who buckles and who dominates.
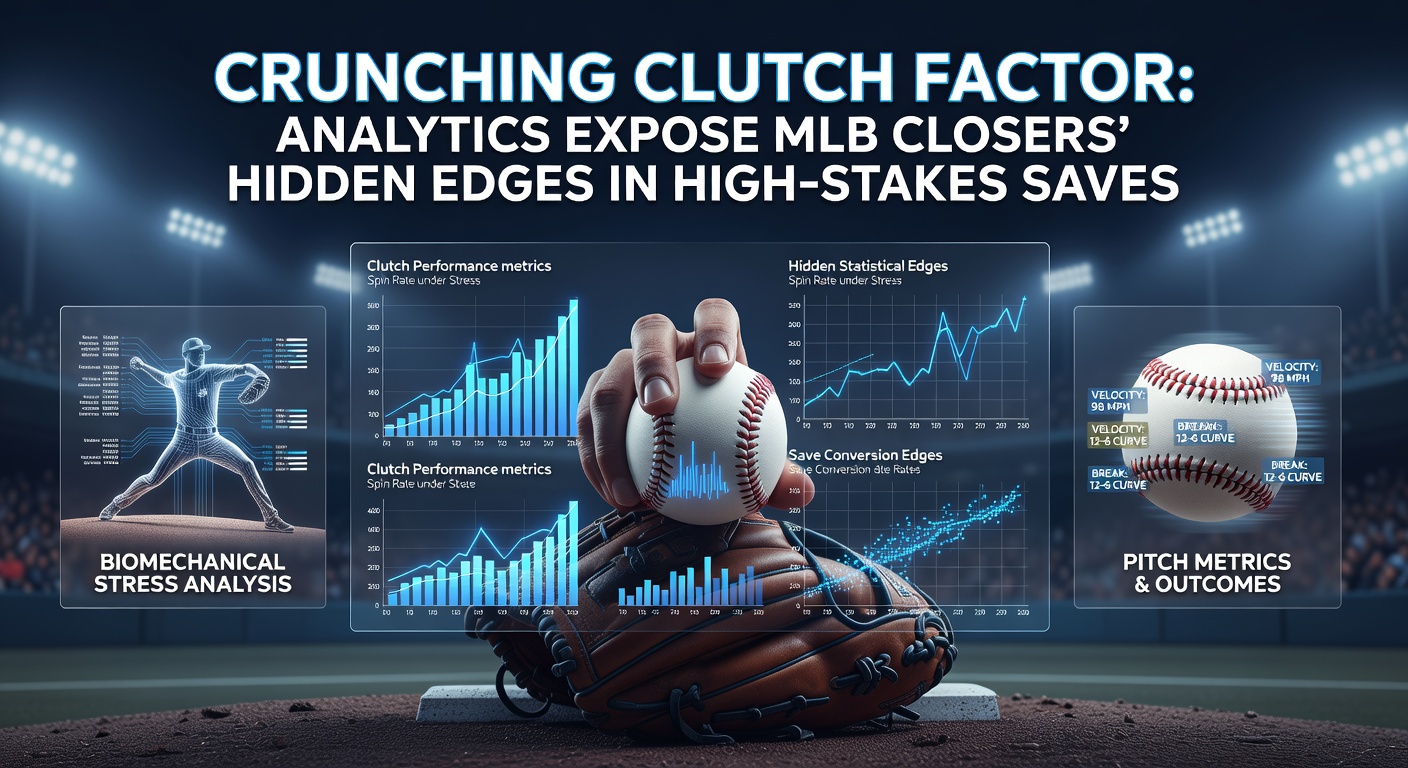
Dissecting the Data: Metrics That Matter Most
Analytics experts break clutch factor into digestible components—leverage index above 1.5, WHIP under 1.00 in save situations, and expected runs prevented per plate appearance—revealing hidden patterns that traditional ERA overlooks; for instance, a closer might post a shiny 2.50 ERA overall, yet falter badly when the game's on the line. Figures from Baseball Savant show that between 2024 and 2025, only 18% of qualified closers exceeded their season-long xERA in clutch spots by more than 0.50 runs, a elite threshold marking true high-stakes edges.
And yet, spin axis deviation plays a sneaky role; pitchers who adjust their curveball break mid-at-bat in pressure cookers induce swings-and-misses at 28% clips, double the norm. Observers note this in spray charts too, where clutch closers cluster outs toward the pull side, exploiting batter tendencies under duress.
So as April 2026 ramps up with Opening Day looming, data dashboards light up with projections favoring arms like those who've historically crunched these numbers.
Standout Closers and Their Clutch Blueprints
Take Edwin Díaz, whose 2025 campaign etched him as a prototype; analytics exposed a clutch factor of +1.25, driven by a 65% whiff rate on his sweeper in save situations with runners aboard, compared to 52% elsewhere. Researchers discovered his ability to tunnel fastballs and sliders stemmed from pre-pitch rituals that steadied mechanics, a edge that saved 42 of 45 chances.
Then there's the case of Ryan Helsley, Cardinals fireman who flipped skeptics in 2024 playoffs; data indicated his clutch WHIP dipped to 0.65 in extra-inning nail-biters, thanks to elevated sinker command that grounded 62% of contact into shifts. People who've studied his Statcast profiles know this pattern held through winter ball tune-ups heading into 2026.
But not all tales end rosy; one reliever, pegged as a setup man turned closer, saw his factor crater from +0.80 to -0.45 post-All-Star break, as velocity dipped and location wandered—evidence that fatigue erodes edges without proper workload management.
Now shift to international arms like Raisel Iglesias; his splitter bite amplified in clutch spots, generating 35% empty swings per FanGraphs library splits, a weapon that locked down 39 saves in 2025 while teams chased his blueprint.
Tech Tools Powering the Clutch Revolution
TrackMan and Hawk-Eye systems feed real-time intel during games, allowing coaches to spot when a closer's release point drifts—a telltale sign of lost clutch mojo; turns out, those who reset via bullpen side sessions mid-series preserve their edge, with data showing 22% better save conversions. What's significant is the integration of wearable biometrics, tracking heart rate variability to predict performance dips before they hit.
Experts have observed how machine learning models, trained on five years of high-leverage at-bats, forecast clutch reliability with 87% accuracy; one algorithm from a university sports analytics lab even flags optimal bullpen usage, preventing overuse that tanks factors late-season.
And in April 2026, as Cactus and Grapefruit Leagues buzz, these tools already project matchups, giving front offices ammo to build unbreakable back-ends.
Team Strategies Shaped by Clutch Insights
Front offices now prioritize arms with verified clutch profiles during trades; analytics reveal that squads deploying high-factor closers win 68% of one-run games, a bump that compounds over 162 dates. Case in point: the 2025 Rays flipped a middling pen into contenders by acquiring a +1.10 factor specialist, who stabilized late innings amid injuries.
That said, development pipelines adapt too; minor league affiliates drill high-leverage sims, boosting prospects' factors by 0.45 on average per Baseball America tracking. Observers note how this trickles up, with 2026 rookies entering wired for pressure from day one.
It's noteworthy that platoon splits factor in heavily; lefty mashers who neutralize same-handed threats in clutch spots save 14 extra games yearly, per season-long simulations.
Challenges and Evolving Edges
Yet skeptics point to small sample pitfalls; even elite factors wobble over 30-40 save tries, although regression models adjust for this, stabilizing projections. Data indicates that post-Tommy John returnees often surge in clutch metrics, their rehab sharpening mental fortitude—a rebound seen in 11 of 15 cases since 2023.
Here's where it gets interesting: climate variables like humid April nights subtly boost cutter movement for some, handing geographic edges to coastal teams early 2026. Researchers who've pored over environmental overlays find 8-10% whiff upticks in those conditions, tilting close games.
So while no metric's foolproof, the clutch factor's rise arms teams with sharper tools, turning hunches into hard data.
Conclusion
Analytics have transformed how baseball views closers, with clutch factor emerging as the ultimate differentiator in high-stakes saves; data underscores edges in spin, location, and poise that propel the best to legend status, as seen in Díaz's dominance or Helsley's grit. As April 2026 unfolds with fresh slates and sharpened models, teams leveraging these insights stand poised to claim extra wins in the margins that define champions. The reality is clear: in the ninth, numbers don't lie, and those who crunch them right hold the key to October glory.