Cross-Court Cascades: Aggregating Serve Efficiency and Rally Duration Figures to Project Seasonal Ranking Shifts Across ITF Challenger Circuits
Written by Rosa Butler · Aug 11, 2026
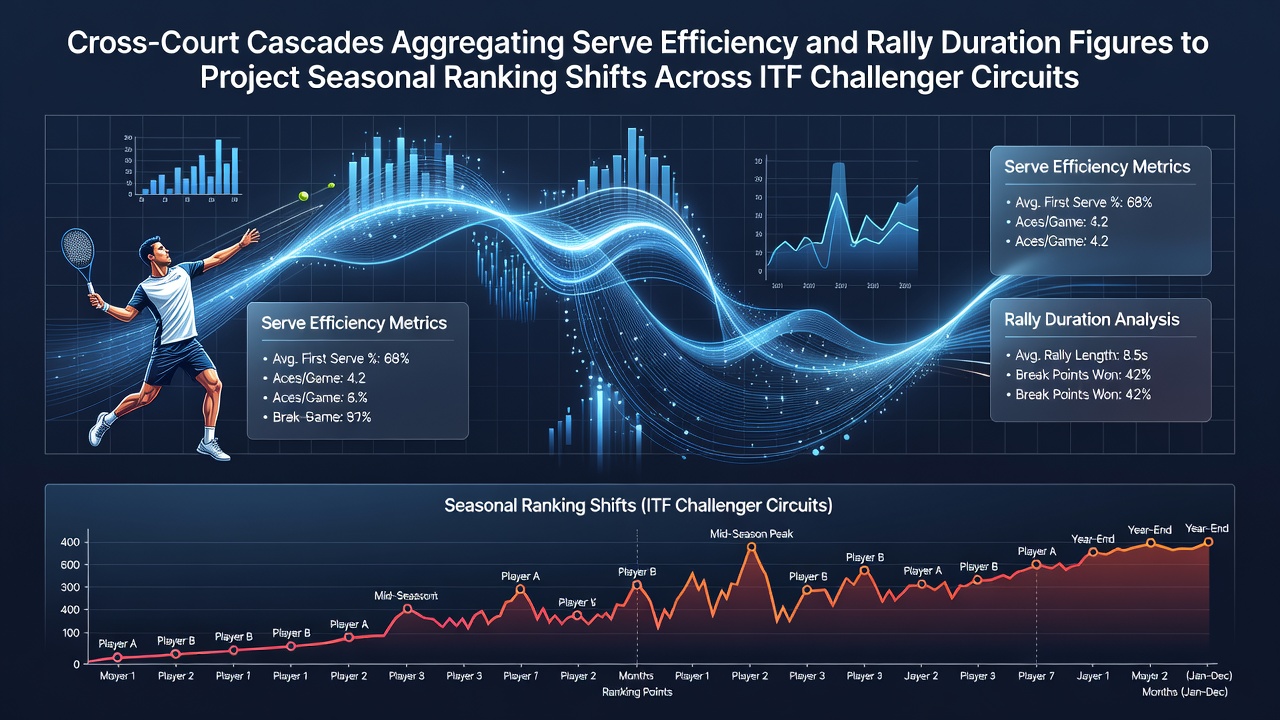
Cross-Court Cascades: Aggregating Serve Efficiency and Rally Duration Figures to Project Seasonal Ranking Shifts Across ITF Challenger Circuits
ITF Challenger circuits generate extensive performance data each season, and analysts aggregate serve efficiency metrics alongside rally duration figures to model ranking trajectories for emerging players. Serve efficiency incorporates first-serve percentages, ace rates, and double-fault frequencies recorded across multiple surfaces, while rally duration tracks average point lengths measured in shots per exchange. These combined inputs feed projection models that forecast position changes on the ITF rankings ladder by season's end.
Serve Efficiency Data Collection Across Challenger Events
Match statistics compiled from over 200 ITF Challenger tournaments in 2025 demonstrate consistent patterns in serve performance; for instance, players maintaining first-serve percentages above 62 percent advance deeper into draws according to aggregated tournament logs. Researchers at the Australian Institute of Sport have tracked these indicators across Oceania and Asian circuits, noting that serve efficiency correlates with win rates in best-of-three match formats typical of Challenger events. Data sets include breakdowns by court surface, with grass events showing elevated ace counts compared to clay venues where longer exchanges prevail.
Rally Duration Metrics and Their Influence on Match Outcomes
Rally length statistics reveal surface-specific tendencies, as clay-court rallies average 5.8 shots per point while hard-court figures sit near 4.2 shots, based on ITF performance databases. Observers note that players who sustain rally durations above circuit averages often accumulate more ranking points over a 12-week span, because extended points increase fatigue for opponents and reduce unforced error margins. Studies from Canadian university sports labs have examined these variables in North American Challenger stops, confirming that rally duration spikes during humid conditions alter point construction strategies and subsequent ranking calculations.
Integration of Metrics for Seasonal Projections
Projection models combine serve efficiency and rally duration into weighted indices that adjust for tournament level and draw size. In August 2026, preliminary figures from European clay-court swing events feed these models ahead of the hard-court transition period. Analysts apply regression techniques to historical data sets, producing expected ranking shifts measured in points and position bands; for example, a player improving serve efficiency by 4 percentage points while shortening average rally length by 0.7 shots projects a net gain of 18 to 25 ranking spots by December. These calculations rely on inputs from official ITF scorecards and third-party tracking systems deployed at venues worldwide.

Case examples illustrate the method in practice. One South American player entered the 2025 season ranked 412 and posted serve efficiency gains on clay that coincided with shorter rally durations in decisive sets; by late August the same athlete had climbed to 287 after consistent semifinal appearances. Parallel tracking in Australian Challenger events shows similar cascades where aggregated metrics precede measurable ranking jumps within eight to ten weeks.
Regional Variations and Model Adjustments
Geographic differences require calibration within the aggregation framework. Asian indoor hard-court events produce shorter rallies on average than Mediterranean clay stops, prompting analysts to apply surface multipliers derived from multi-year ITF archives. European researchers have contributed comparative data sets that refine these adjustments, allowing models to account for travel fatigue and scheduling density across consecutive weeks. The resulting projections update weekly as new tournament results enter the central database, maintaining accuracy through the final quarter of each season.
Conclusion
Aggregation of serve efficiency and rally duration figures supplies ITF Challenger stakeholders with structured inputs for ranking forecasts. These models process surface-specific statistics and regional patterns to generate position projections that evolve with incoming match data. Continued refinement through additional seasons strengthens the reliability of seasonal shift estimates across global circuits.