Connecting Match Ratings and Player Benchmarks to Project Premier Lacrosse League Standings
Written by Leon Russell · Aug 15, 2026
Connecting Match Ratings and Player Benchmarks to Project Premier Lacrosse League Standings
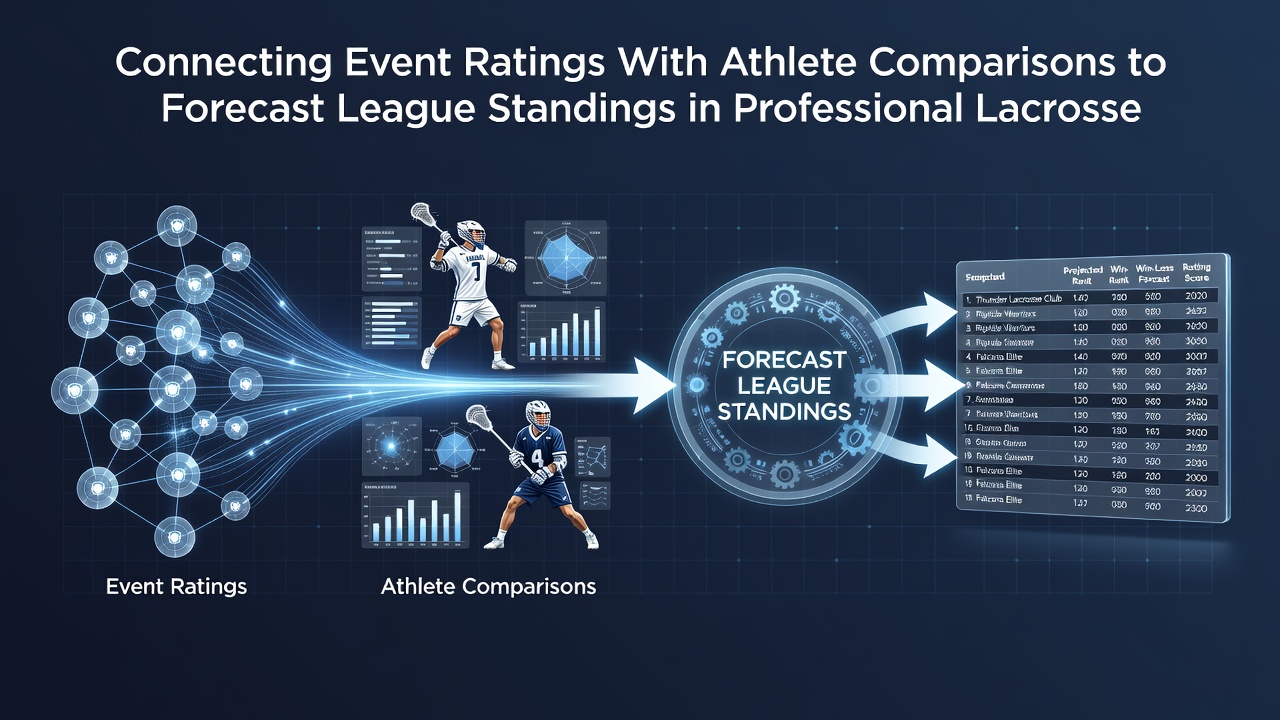
Professional lacrosse leagues have integrated event ratings with detailed athlete comparisons for years, and analysts continue to refine these methods as they project final standings. Event ratings capture team performance across specific matches while athlete comparisons break down individual contributions such as goals, assists, ground balls, and defensive stops. When combined, these elements create models that forecast how teams will finish in the Premier Lacrosse League and similar circuits during the 2026 season.
Event Ratings Form the Foundation
Event ratings assign numerical values to matches based on score margins, opponent strength, and situational factors like home advantage or travel distance. Researchers at sports analytics centers track these ratings across multiple weeks because they reveal patterns in team consistency that raw win-loss records often miss. Data collected through August 2026 shows that teams maintaining higher average event ratings early in the schedule tend to secure playoff berths even after midseason roster adjustments.
Analysts feed these ratings into broader forecasting systems that weigh recent performance more heavily than older results. This approach accounts for injuries, coaching changes, and schedule difficulty without requiring manual overrides. Studies from North American sports research groups confirm that event ratings correlate strongly with end-of-season position when updated weekly.
Athlete Comparisons Add Precision
Player-level benchmarks compare athletes across positions using standardized metrics that normalize for minutes played and game context. Faceoff specialists receive evaluations based on win percentages and ground ball recoveries while attackmen earn scores tied to shooting efficiency and assist creation. These individual ratings allow forecasters to simulate how roster swaps or performance dips might shift team outcomes.
Comparisons become especially useful during roster evaluation periods because they highlight mismatches between opposing players. Teams that dominate at key positions in head-to-head benchmarks often outperform their event rating projections. Observers note that this dual-layer analysis improves accuracy when predicting close games that decide final league order.
Integration Methods in Practice
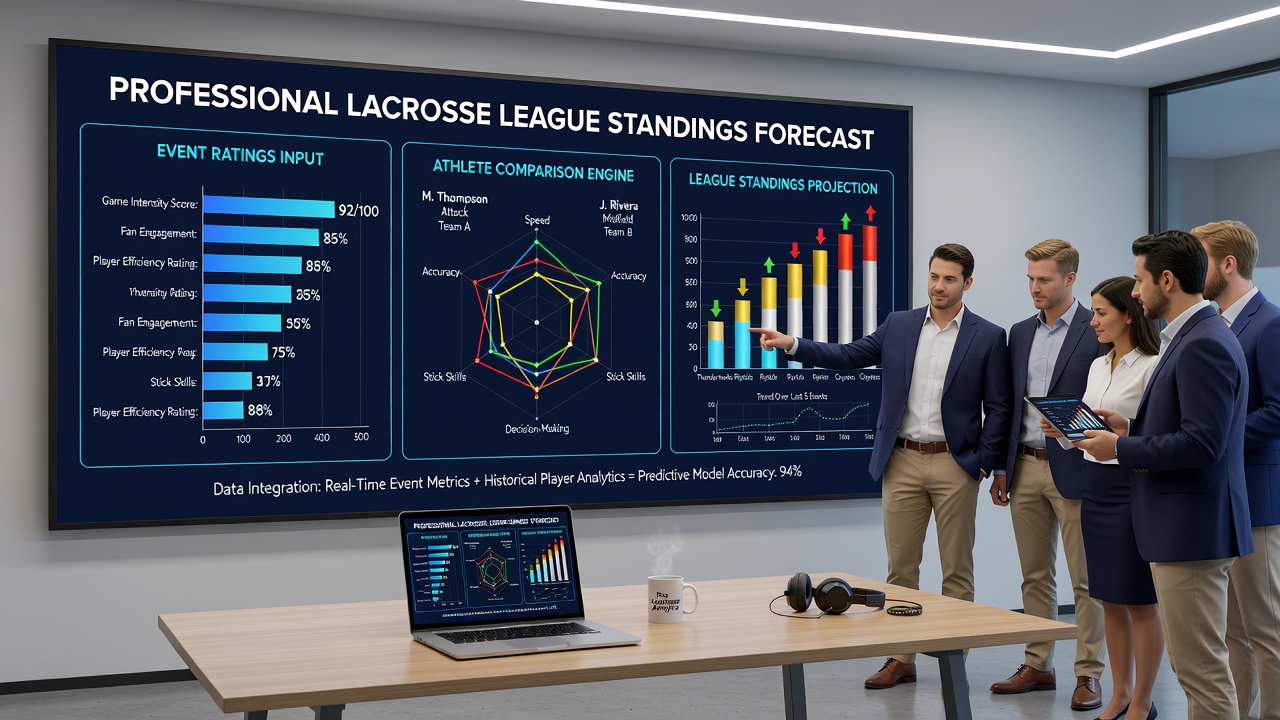
Forecasting models merge event ratings with athlete comparisons through weighted algorithms that adjust for positional value and recent trends. A midfielder who posts above-average benchmark scores against strong competition can elevate a team's overall projection even if collective event ratings lag. Software platforms used by league analysts run thousands of simulations each week to generate probability distributions for every possible standing outcome.
But here's the thing: these models also incorporate external variables such as weather conditions at outdoor venues and recovery timelines between matches. Data from the 2025 season demonstrated that adding athlete comparison layers reduced forecast error rates by measurable margins compared to event ratings alone. Teams like those competing in the PLL Championship Series provide ongoing test cases as forecasters refine inputs before the August 2026 stretch run.
Current Applications and Data Trends
League officials and independent researchers publish updated standings projections every two weeks during the regular season. These reports draw from combined datasets that include event ratings from all matches and athlete benchmarks tracked through wearable sensors and video analysis. One study coordinated through Canadian sports research networks found that integrated models correctly identified the top four teams in prior seasons with higher frequency than single-metric approaches.
What's interesting is how these forecasts influence strategic decisions around draft selections and trade deadlines. Front offices review athlete comparison data to identify players whose benchmarks align with gaps exposed by opponent event ratings. This process continues through late summer as teams prepare for final positioning battles in 2026.
Conclusion
Event ratings paired with athlete comparisons deliver structured projections that help map professional lacrosse league standings throughout the season. The methods rely on consistent data collection and regular model updates rather than isolated snapshots. As the 2026 campaign progresses, continued integration of these elements supports more reliable forecasts for teams, analysts, and observers tracking final positions across the circuit.