Charting Endurance Curves: Longitudinal Tracking of Cyclist Power Outputs Across Multi-Stage Races
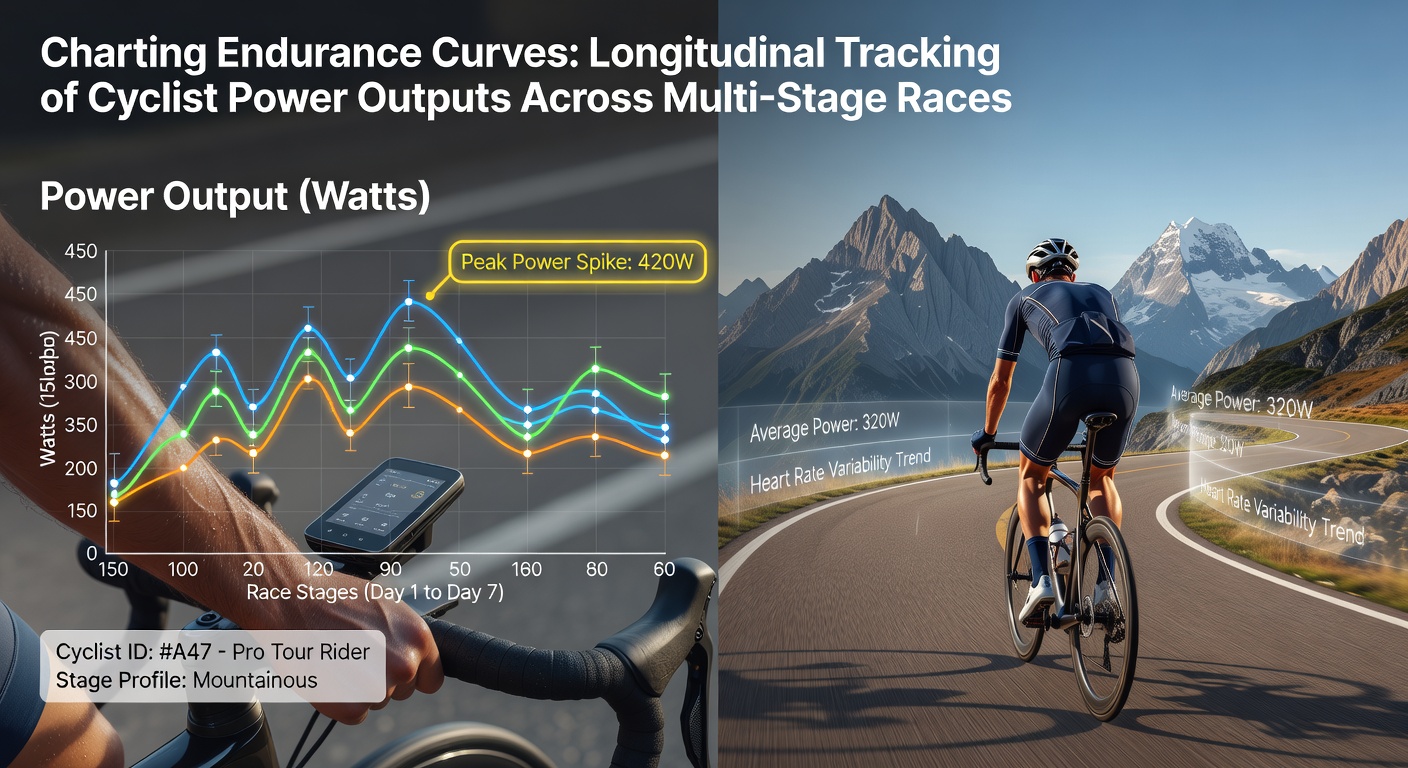
Multi-stage cycling races demand sustained power management over consecutive days of competition, and teams now rely on detailed longitudinal tracking to map how output levels shift from one stage to the next. Power meters attached to bicycles record wattage at frequent intervals, allowing analysts to build endurance curves that reflect fatigue accumulation, recovery patterns, and tactical adjustments throughout events like the Giro d'Italia, which unfolds each May. In May 2026 observers note continued refinement of these datasets as riders complete sequences of flat, hilly, and mountain stages while sensors capture real-time variations in normalized power and torque.
Power Meter Technology and Data Collection Methods
Strain-gauge sensors mounted in crank arms, pedals, or hubs measure force applied during each pedal stroke, and the resulting figures feed directly into onboard computers that log averages, peaks, and variability indexes. Teams integrate GPS coordinates with these readings so that power output can be contextualized against elevation gain, wind direction, and road surface, while software platforms aggregate daily files into season-long profiles. Researchers have documented how sampling rates above 1 Hz improve accuracy when detecting micro-variations that signal early fatigue during long transfers between stages.
Building Longitudinal Endurance Curves
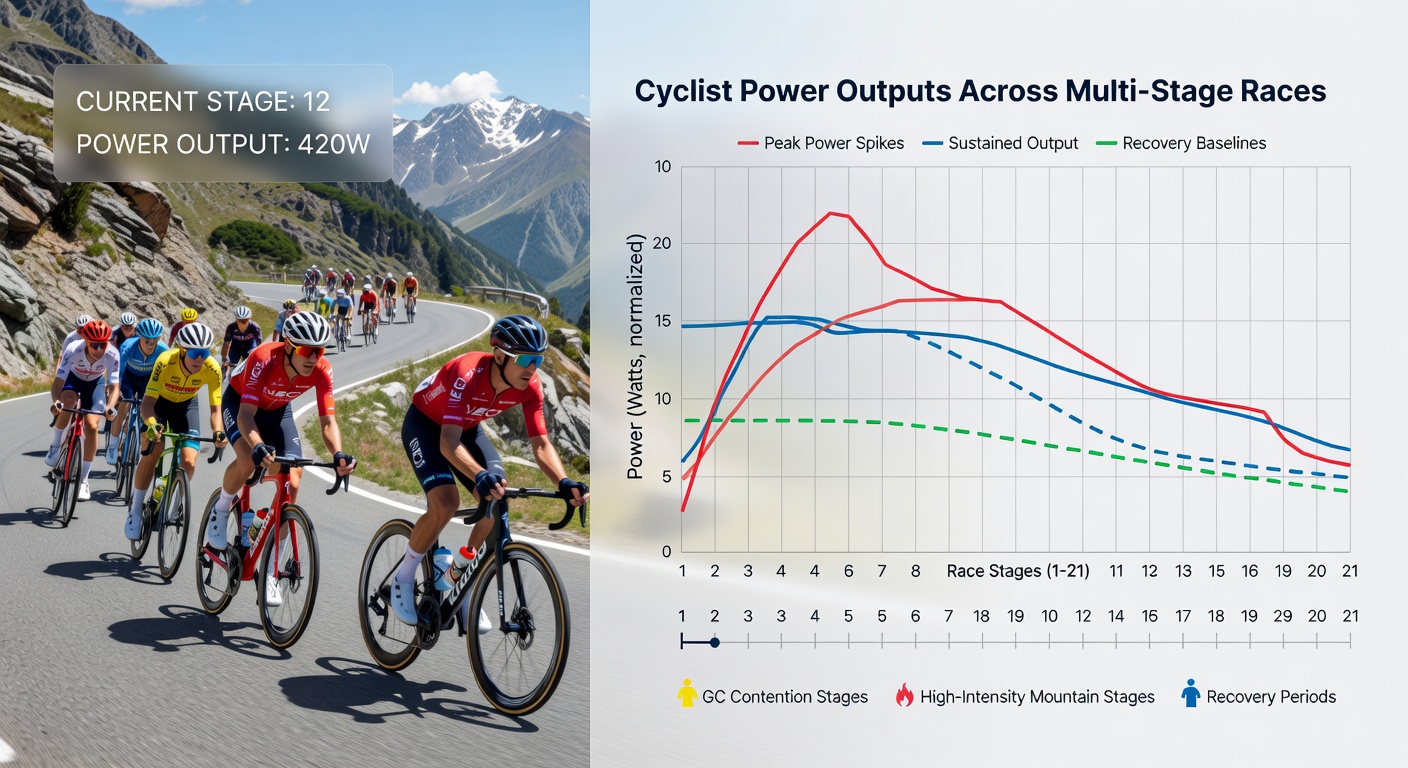
Analysts plot daily mean maximal power across multiple durations, typically 5 seconds, 1 minute, 5 minutes, and 20 minutes, then connect these values across successive race days to reveal downward or stable trends. A curve that shows preserved 20-minute power after four consecutive mountain stages indicates superior recovery capacity, whereas a steep decline often correlates with accumulated glycogen depletion. Studies from the Australian Institute of Sport demonstrate that riders who maintain at least 85 percent of their fresh-state 20-minute power through day six of a Grand Tour exhibit higher overall classification finishes.
Key Metrics Tracked Across Stages
- Normalized power: accounts for variable terrain and provides a smoothed intensity metric comparable day to day
- Variability index: ratio of normalized power to average power that highlights pacing consistency
- Functional threshold power decay: progressive drop in sustainable output measured at the end of each stage
- Peak power repeatability: ability to reproduce high-intensity bursts after prior fatigue
Coaches overlay heart-rate drift and perceived exertion scores onto these curves to cross-validate external load data, and the combined picture guides individualized pacing strategies for upcoming stages. One study published by the European College of Sport Science examined 47 professional riders across three consecutive Grand Tours and found that those whose endurance curves remained within a 6 percent band of baseline values achieved 23 percent more top-ten stage results.
Case Examples from Recent Multi-Stage Events
During the 2025 Vuelta a España, data collected from a leading team's domestiques showed that 20-minute power dropped an average of 12 percent between stages 9 and 15, yet several riders restored output to within 4 percent of opening-week levels by stage 18 after scheduled rest days. Observers note similar patterns in the 2026 Giro d'Italia where flatter early stages preserved higher peak power repeatability, allowing climbers to allocate reserves for later mountain finishes. Software dashboards now flag when a rider's current curve deviates more than two standard deviations from personal historical norms, prompting immediate nutritional or pacing interventions.
Integration with Recovery and Nutrition Protocols
Teams correlate power-curve inflections with sleep metrics captured by wearable devices and with carbohydrate intake logs recorded during feed zones. Riders whose post-stage glycogen replenishment exceeds 8 grams per kilogram of body weight typically exhibit flatter endurance curves on subsequent days, according to figures released by the Canadian Sport Institute. Monitoring software flags when torque variability rises above established thresholds, suggesting neuromuscular fatigue that may require adjusted training loads between race days.
Future Developments in Endurance Tracking
Emerging machine-learning models trained on multi-season datasets predict power-output trajectories several stages ahead, and early validation trials indicate improved accuracy when models incorporate weather variables and individual recovery coefficients. Governing bodies such as the Union Cycliste Internationale continue to evaluate standardized data formats that would allow cross-team benchmarking while maintaining competitive confidentiality. As sensor fusion techniques advance, longitudinal curves are expected to incorporate additional streams from muscle-oxygen sensors and aerodynamic drag estimates, further refining the resolution of endurance monitoring.
Conclusion
Longitudinal tracking of cyclist power outputs across multi-stage races has shifted from basic wattage logs to sophisticated curve analysis that informs daily strategy and long-term athlete development. Data collected through May 2026 continues to demonstrate that riders and teams who maintain detailed endurance profiles gain measurable advantages in stage outcomes and overall classification performance. Continued refinement of collection methods and integration with recovery parameters promises even greater precision in the seasons ahead.